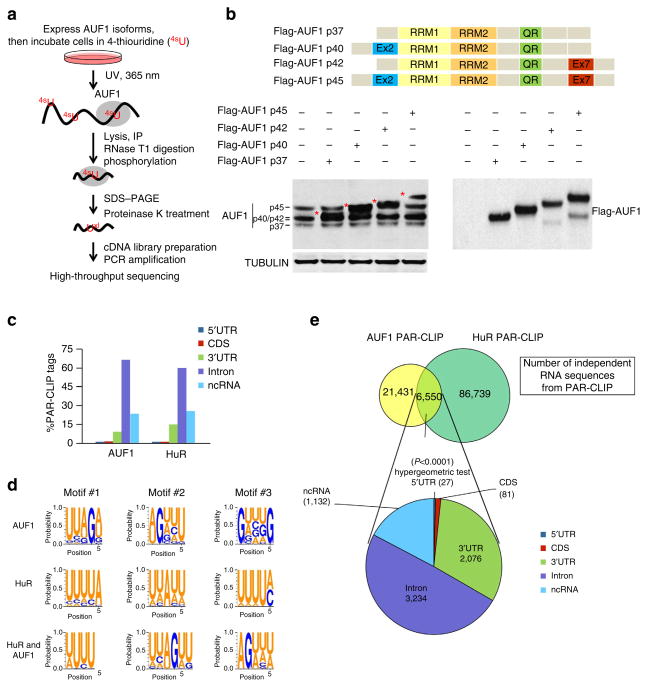
Figure 1. Identification of AUF1 target RNA sequences using PAR-CLIP analysis.
(a) Schematic of PAR-CLIP analysis. (b) Expression levels in transfected HEK293 cells (left) and domain organization (right) of each AUF1 isoform. Levels of endogenous AUF1 (p37, p40, p42 and p45 isoforms indicated) and ectopic Flag-AUF1 48 h after transfection as detected by western blot analysis of total AUF1, Flag and loading control α-TUBULIN; tagged AUF1 (marked with *) is slightly larger than endogenous AUF1 (Supplementary Fig. 7). (c) Percentage of AUF1 and HuR PAR-CLIP tags in mature mRNAs, introns and ncRNAs. (e) Schematic of shared binding sites among AUF1 and HuR PAR-CLIP libraries; the significance (P) of the overlap is indicated. (d) Representative (top three) RREs from AUF1 and HuR PAR-CLIP.

