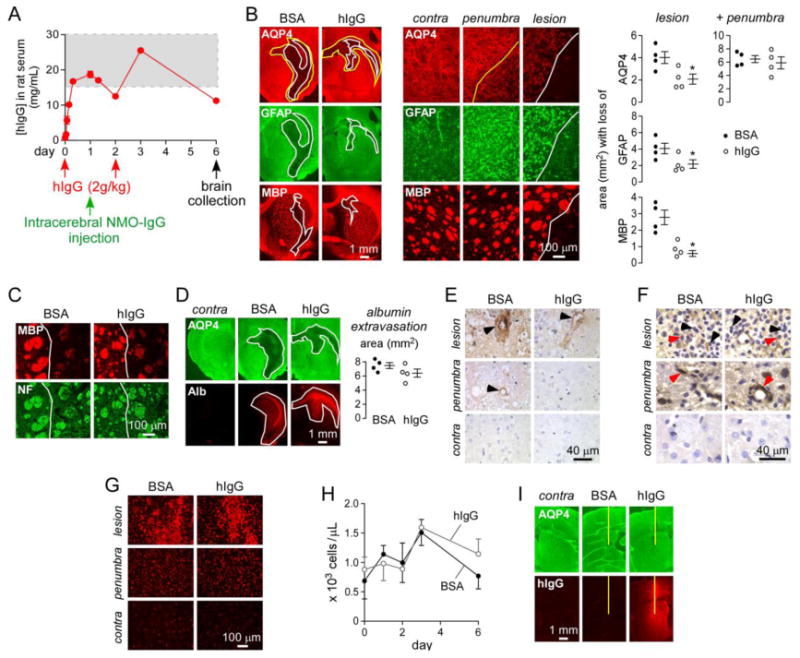
Figure 1. hIgG reduces NMO-IgG pathogenicity in rat brain in vivo.

A. Rats were administered hIgG or BSA intraperitoneally at day 0 and day 2, and 750 μg NMO-IgGserum was injected intracerebrally at day 1. Brains were collected at day 6. Graph shows serum hIgG concentration as measured by human IgG ELISA (mean ± S.E., n=4). Dashed rectangle indicates therapeutic levels of hIgG in human serum. B. (left) AQP4, GFAP and myelin (MBP) immunofluorescence in BSA- and hIgG-treated rats. White line delimits the central lesion with loss of AQP4, GFAP and MBP. Yellow line delimits the penumbra area with selective loss of AQP4. (middle) Higher magnification of the contralateral (non-injected) hemisphere, penumbra and lesion. (right) Area with loss of AQP4, GFAP and MBP in the central and total (central + penumbra) lesion (mean ± S.E., n=4, * P < 0.05). C. MBP and neurofilament (NF) immunofluorescence in the central lesion (white line) of rats studied in A. D. Staining for AQP4 and albumin (Alb) in BSA- and hIgG-treated rats. Contra: contralateral non-injected brain hemisphere. White line delimits the area of AQP4 loss and albumin extravasation. (right) Area of albumin extravasation (mean ± S.E., n=4). E. C5b-9 staining in lesion, penumbra and contralateral hemisphere. Arrowheads denote perivascular complement deposition. F. CD45 immunohistochemistry. Black arrowhead shows granulocytes and red arrowhead macrophages. G. Iba1 immunofluorescence for microglia/macrophages. H. Neutrophil blood counts in BSA- and hIgG-treated rats (mean ± S.E., n=4). I. Anti-human IgG staining of brains from rats administered intraperitoneally with hIgG or BSA followed by intracerebral injection of PBS. Contra: contralateral non-injected brain hemisphere. Yellow line represents needle tract.
