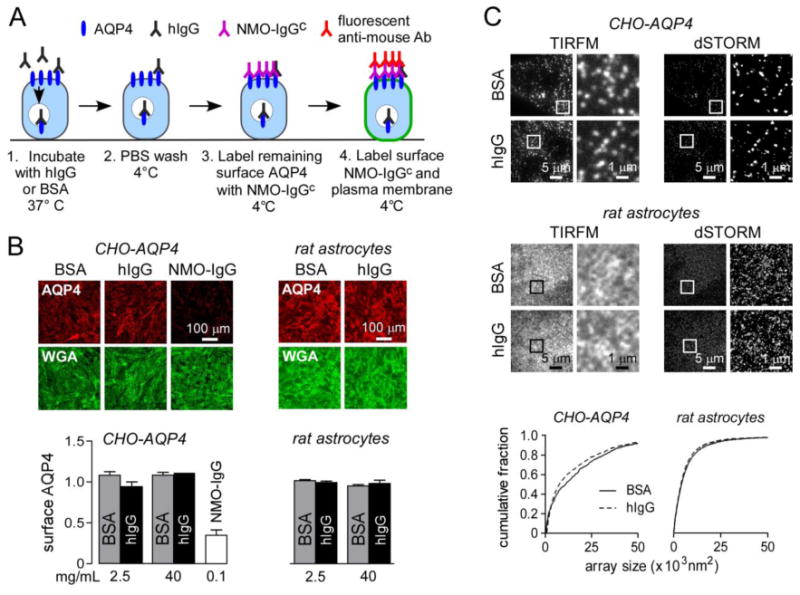
Figure 2. hIgG does not affect AQP4 cell surface expression or assembly in OAPs.

A. Experimental protocol to quantify cell surface AQP4. B. Fluorescence micrographs showing surface AQP4 (red) and plasma membrane staining (wheat germ agglutinin, WGA, green) in CHO-AQP4 cells and rat astrocytes incubated for 3 h at 37 °C with 40 mg/mL BSA or hIgG (or 100 μg/mL NMO-IgG as positive control). Graphs show cell surface AQP4 quantified as red to green fluorescence ratio (1.0 corresponds to cell surface AQP4 without BSA or hIgG) for indicated concentrations of BSA or hIgG (mean ± S.E., n=5). C. TIRFM and dSTORM imaging of AQP4 OAPs in CHO-AQP4 cells and rat primary astrocytes following incubation with 40 mg/mL BSA or hIgG for 3 h at 37 °C. Graphs represent OAP size distribution.
