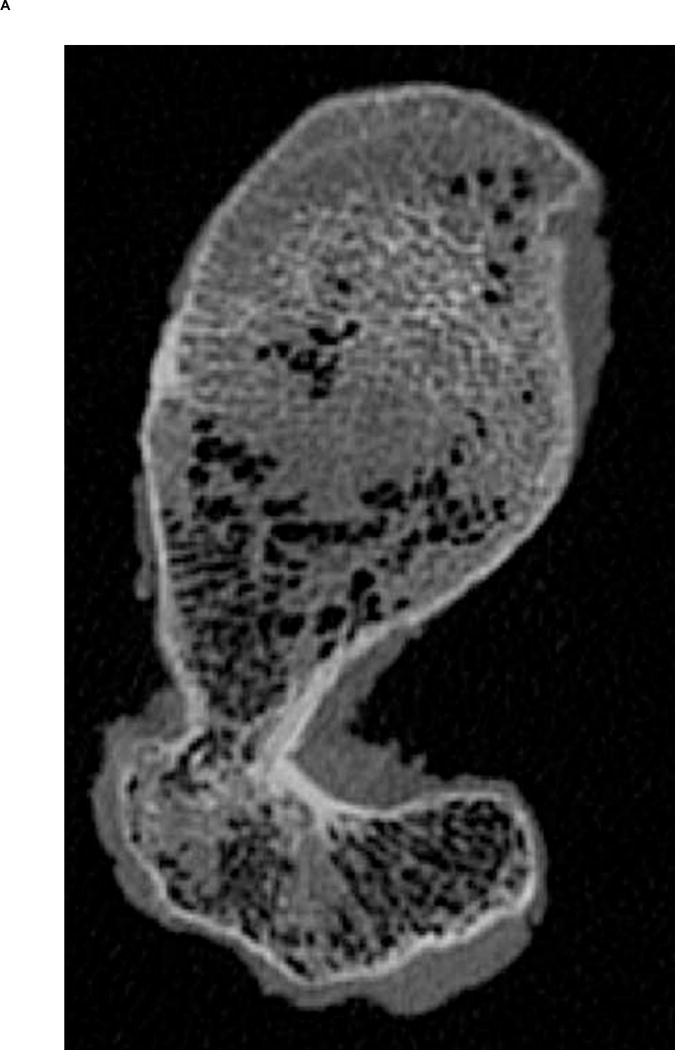
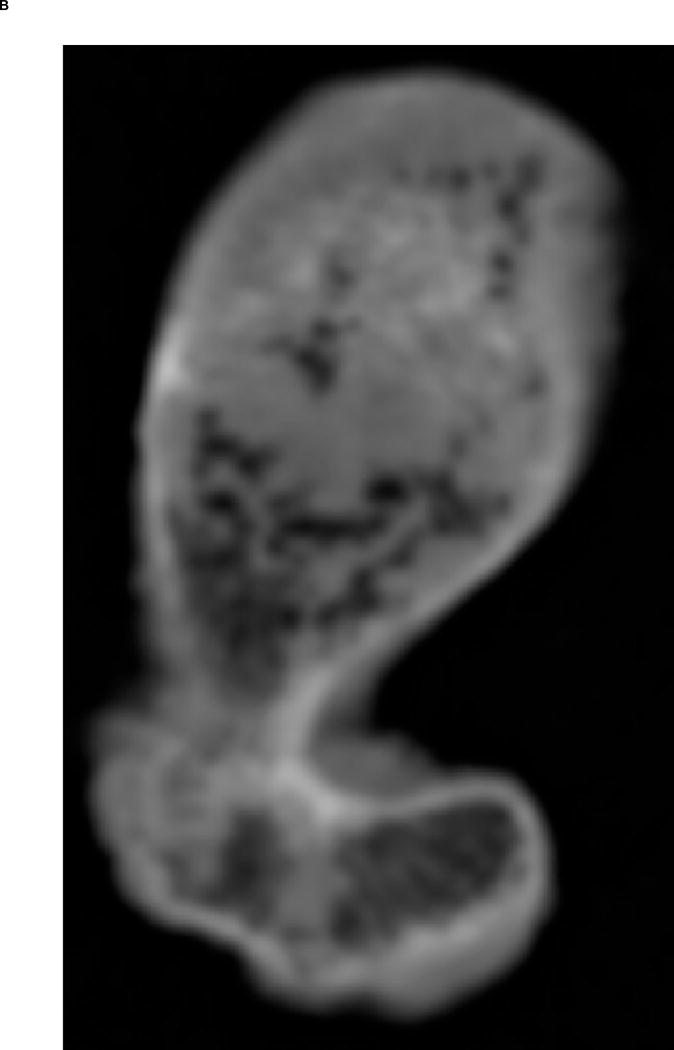
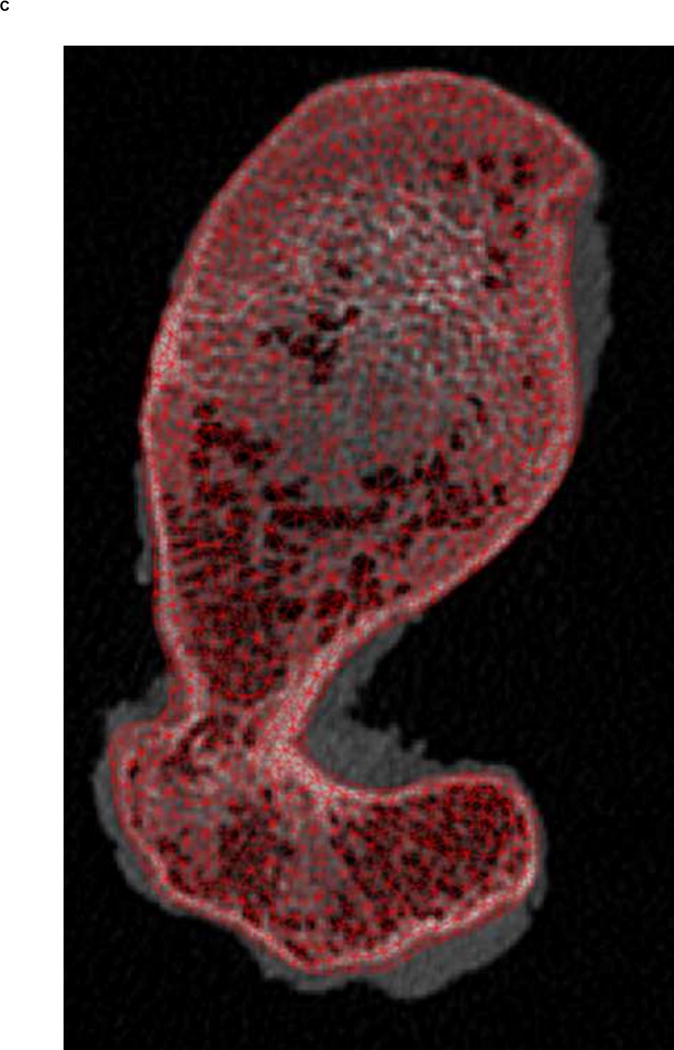
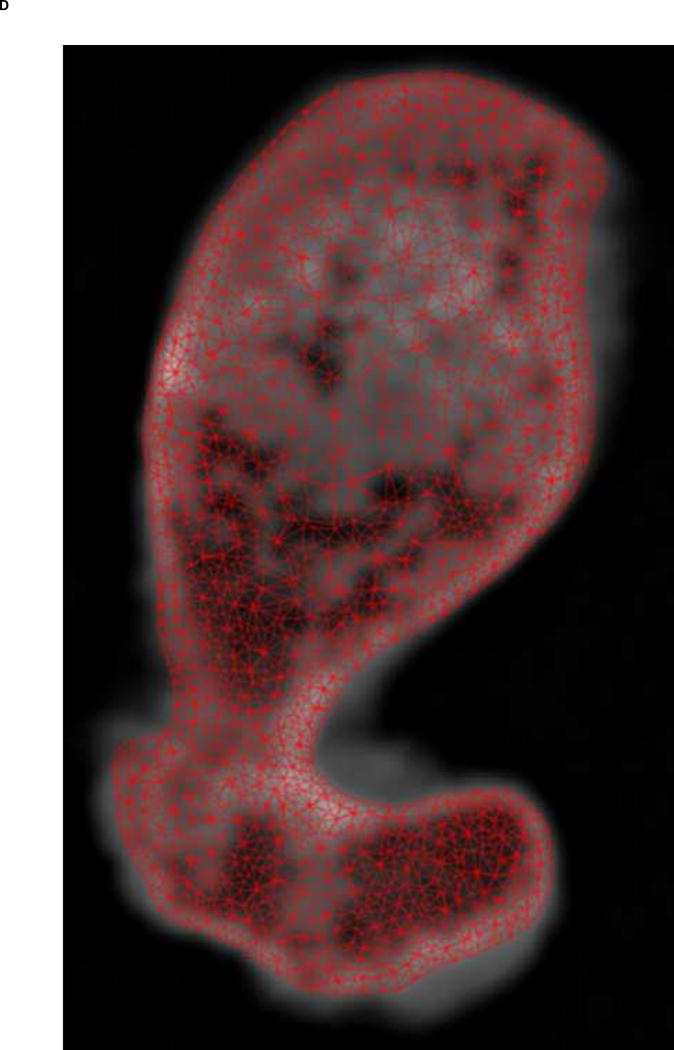
Figure 1.


A. Transverse view of proximal femur metaphysis using high resolution QCT scanning settings. B. Transverse view of proximal femur metaphysis using low resolution QCT scanning setings. Low resolution image shows lower contrast than high resolution image. C. Transverse cross-section of high resolution QCT/FEA meshed model. D. Transverse cross-section of low resolution QCT/FEA meshed model.
