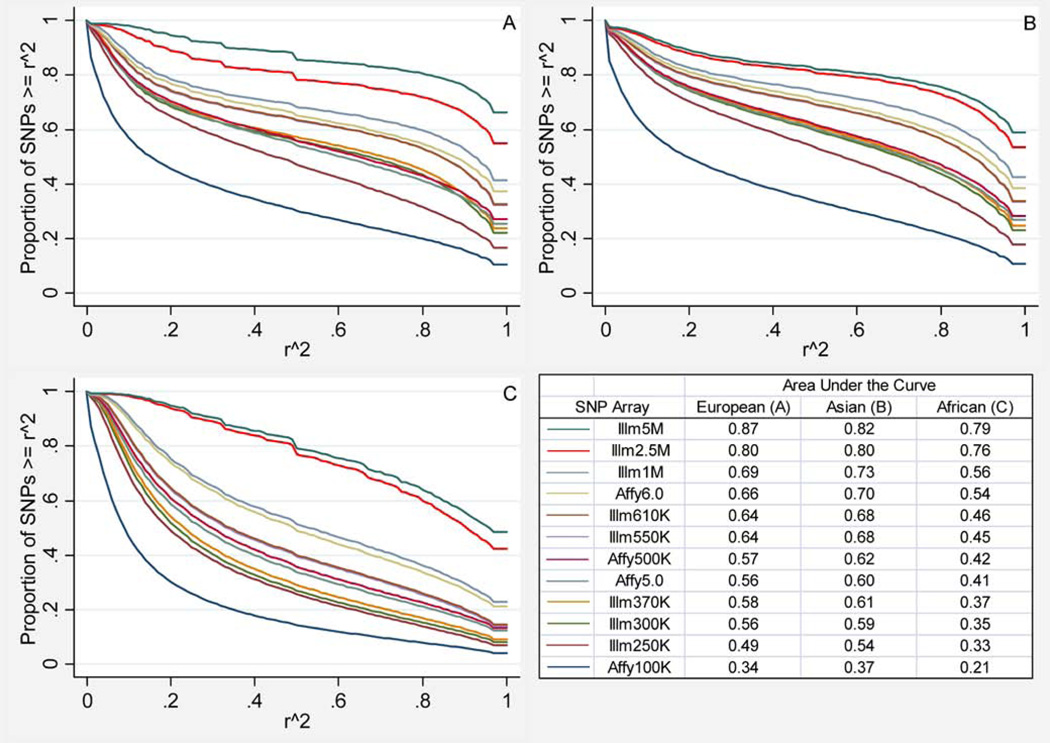
Fig. 1.
Coverage (maximum pairwise r2) of the 1,000 Genomes Project SNPs by microarray and population ancestry. (A) Coverage of SNPs in individuals with European ancestry. (B) Coverage of SNPs in individuals with Asian ancestry. (C) Coverage of SNPs in individuals with African ancestry. The table shows the area under the curve for each microarray and population.

