Figure 3.
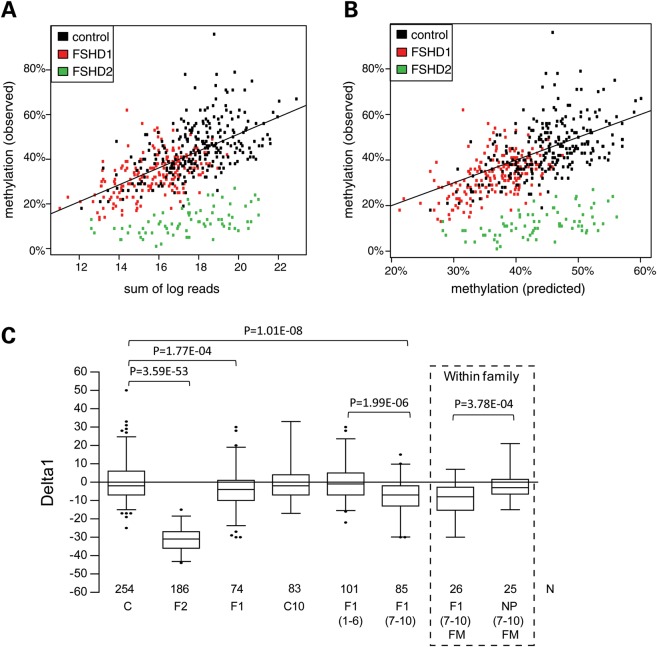
Methylation and repeat array size correlation. (A) Scatterplot showing correlation between the combined D4Z4 methylation level on chromosomes 4 and 10 (OM) and the cumulative repeat array sizes (sum of log reads) for all samples examined in Figure 1B (controls in black; FSHD1 individuals in red and SMCHD1 mutation carriers in green). A logarithmic transformation of the repeat array sizes (units) clearly shows a significant correlation (P < 0.001) between the cumulative log2 values of the four D4Z4 repeat arrays and the methylation level for all three conditions. (B) Scatterplot comparison between OM at D4Z4 and PM from individuals from Figure 3A. The high correlation between both values in controls and FSHD1 individuals shows that it is possible to predict the D4Z4 methylation levels based on the combined size of the four D4Z4 repeat arrays. The OM in SMCHD1 mutation carriers is highly reduced but still correlates with the PM. (C) Boxplot showing the Delta1 for the different conditions. The average Delta1 in controls (C) is almost 0, whereas this value for SMCHD1 mutation carriers (F2) is −31.3% (P = 3.59E − 53). The average Delta1 in FSHD1 individuals (F1) is significantly (P = 1.77E − 04) reduced by 3.6%. The reduction in the average Delta1 was not significant in a subset of the control group (C10) that were selected on the basis of a contracted repeat array on chromosome 10. Further partition of the FSHD1 group based on repeat size showed that the reduced average Delta1 is specific for carriers of a 7–10 unit repeat array [F1(7–10), Delta1 −7.6%, P = 1.01E − 08), whereas the average Delta1 in carriers of a 1–6 unit repeat is almost 0 [F1(1–6)] (P = 0.96). From 26 affected carriers [F1(7–10)FM] of the 7–10 unit FSHD group, we identified 25 family members [NP(7–10)FM] that were non-penetrant carriers of the same FSHD allele (boxed). While the F1(7–10)FM group has a significantly reduced average Delta1 (−9.5%, P = 3.78E − 04) compared with their unaffected family members in group [NP(7–10)FM], the average Delta1 of the latter group was not different from controls. Sequence analysis for all individuals from the F1(7–10) group with Delta1 values below −14 failed to identify a mutation in SMCHD1 (Supplementary Material, Table S2). P-values are shown for groups that show a significant Delta1 reduction compared with the controls (C) and for the most relevant intergroup comparisons. The box extends from the 25th to 75th percentiles, and the whiskers are at the 2.5th and 97.5th percentiles.

