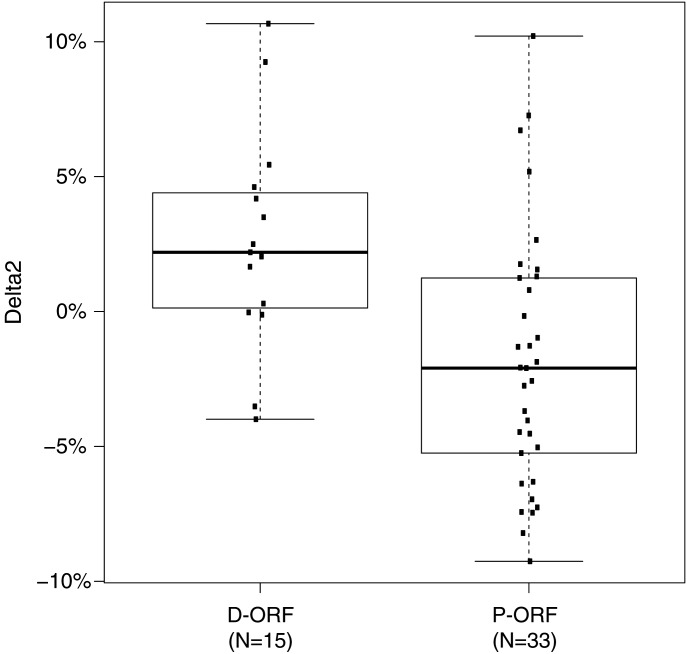
Figure 4.
Comparison of methylation between D-ORF and P-ORF SMCHD1 mutations. Boxplot showing a significantly (P = 0.014) lower Delta2 for P-ORF mutations than for D-ORF mutations. In total, we identified 33 different families with 42 carriers of a P-ORF mutation and 15 families with 32 carriers of a D-ORF mutation. For multiple carriers within one family, an average Delta2 was used. The box extends from the 25th to 75th percentiles, and the whiskers are at 1.5× interquartile range (IQR).

