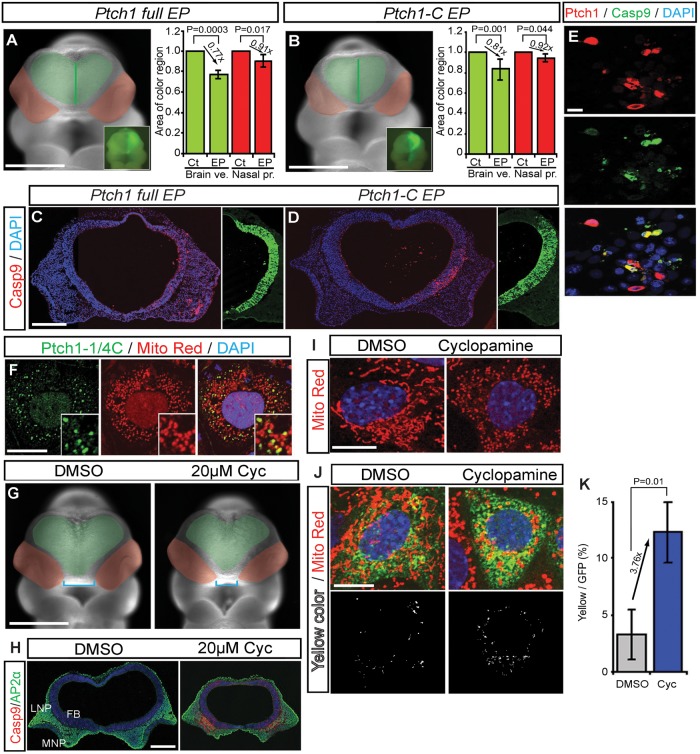
Figure 3.
Caspase cleaved C-terminal Ptch1 translocates to mitochondria during cell death. (A and B) Frontal view of mouse embryos EP with myc-tagged Ptch1 full length (A) and Ptch1 C terminal (Ptch1-C) (B) with pEGFP as reference. Green area demarcates the brain vesicles. Red area indicates the nasal processes. Insets show unilateral electroporation of GFP in the forebrain. (C and D) Frontal sections of E9.5 mouse embryos labeled with cleaved Casp9 after unilateral brain electroporation with control, myc-tagged Ptch1 full-length (C) and Ptch1-C (D) vectors. Nuclei are stained with DAPI. (E) Ptch1 full-length overexpression (red) induces Casp9 activity (green) in mIMCD3 cells. (F) mIMCD3 cells transiently transfected with myc-tagged Ptc1-1/4C (Myc-Pct1-1/4C, green) co-localized with the mitochondria marker, MitoTracker Red. (G) Frontal views of control (DMSO) and 20 µm cyclopamine (Cyc, smoothened antagonist)-treated mouse embryos. (H) Frontal sections of cultured embryos, stained with Casp9 and AP2α. (I) Healthy mitochondria in mIMCD3 cells present with a long tubular shape. 5 µm cyclopamine-treated cells exhibit mitochondria with small bean-shaped morphology. (J) Flag-Ptch1-EGFP stable cells stained with MitoTracker Red under normal and cyclopamine-treated conditions. Mitochondrial localized Ptch1 is indicated by yellow color. (K) Quantification of cyclopamine induces Ptch1 localization in mitochondria. FB, forebrain; FE, foregut endoderm; E, eye; HB, hindbrain. Scale bars: 0.5 mm in (A), (B) and (G); 0.1 mm in (E); 0.2 mm in (C), (D) and (H); 50 µm in (I) and (J).

