Figure 3.
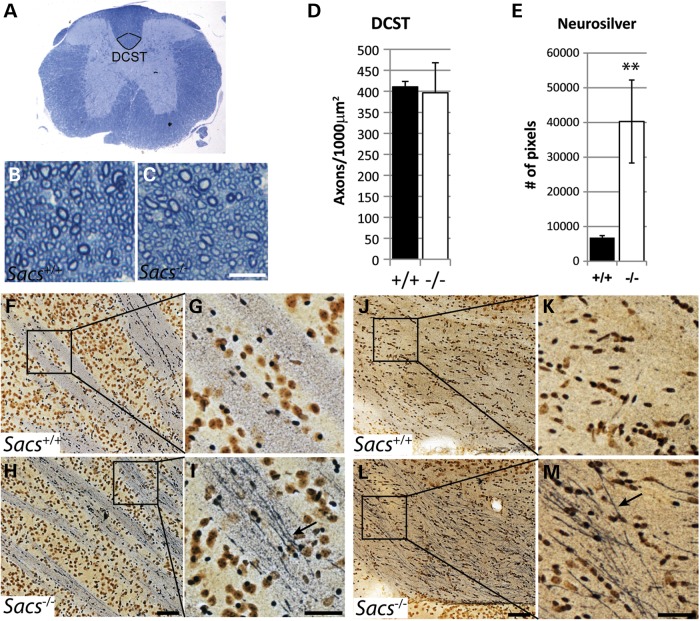
The number of corticospinal axons in Sacs−/− mice does not change significantly, but axons show signs of degeneration. (A) Low power cross section of the thoracic spinal cord of a Sacs+/+ mouse at T12 level with the dorsal corticospinal tract (DCST) outlined. (B and C) Higher power images of toluidine-blue stained 1 µm semi-thin sections from 2-year-old Sacs−/− (C) and age-matched Sacs+/+ (B) mice showing a portion of the DCST (Scale bar = 10 µm). No difference in gross morphology (B and C) or significant loss of corticospinal axons (D) was detected. Data presented are means ± SD of counts from three mice per group. (E–M) Neurosilver stain of parasagittal brain sections of Sacs−/− and Sacs+/+ mice. Quantification of Neurosilver stain pixels show a 5.9-fold increase in cerebral peduncle of Sacs−/− mice compared with controls (E). Greater silver impregnation in corticospinal axons within the internal capsule (arrow in I) and cerebral peduncle (arrow in M) of Sacs−/− compared with age-matched Sacs+/+ mice (G and K). Arrows point to argyrophilic components within Sacs−/− axons (scale bar = 100 µm in H and L and 50 µm in I and M). Data represent means ± SD, n = 3 mice per group; **P < 0.01 (unpaired t-test).

