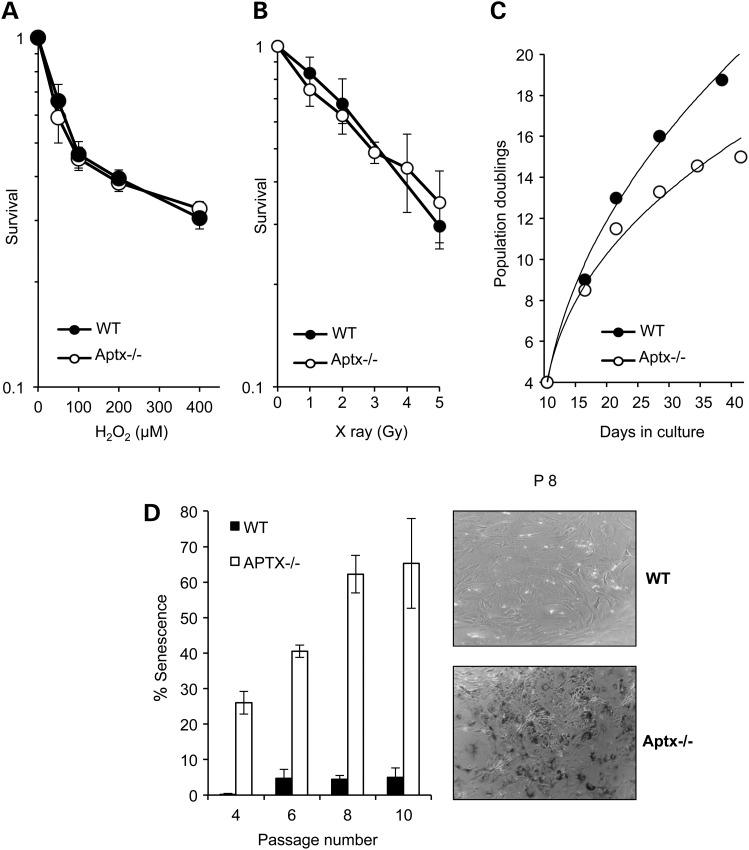
Figure 1.
Accelerated cellular senescence in Aptx−/− cells. Aptx+/+ ‘WT’ and Aptx−/− primary MEFs were exposed to the indicated doses of H2O2 (A) or X-rays (B) and percent survival quantified using clonogenic survival assays. Data are the average ± SEM from three biological replicates (C) Population doublings were calculated over 40 days of continuous culture and representative data are shown from one experiment. (D) MEFs were examined for senescence-associated β-gal (SA-βGal) staining at the indicated passages and β-Gal-positive cells were quantified and expressed as percent of total cells. The difference between WT and Aptx−/− MEFs was statistically significant at all passages examined (P < 0.01, two-way ANOVA) (left). A representative image is depicted (right).

