
Figure 1.
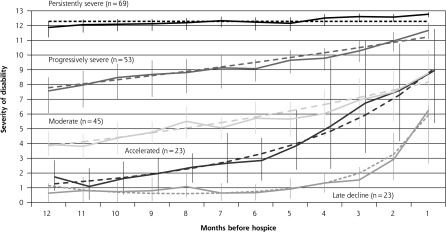
Functional trajectories in the 12 months before start of hospice (N = 213).
Notes: The severity of disability is indicated by the mean number of disabled activities of daily living (basic, instrumental, and mobility). The solid lines indicate the observed trajectories, and the dashed lines indicate the predicted trajectories. Trajectories shown are unadjusted; only minor differences were apparent after adjustment for age and sex. The error bars indicate bootstrapped 95% CIs for the observed severity of disability. The average group membership probability for each group was greater than 0.9.