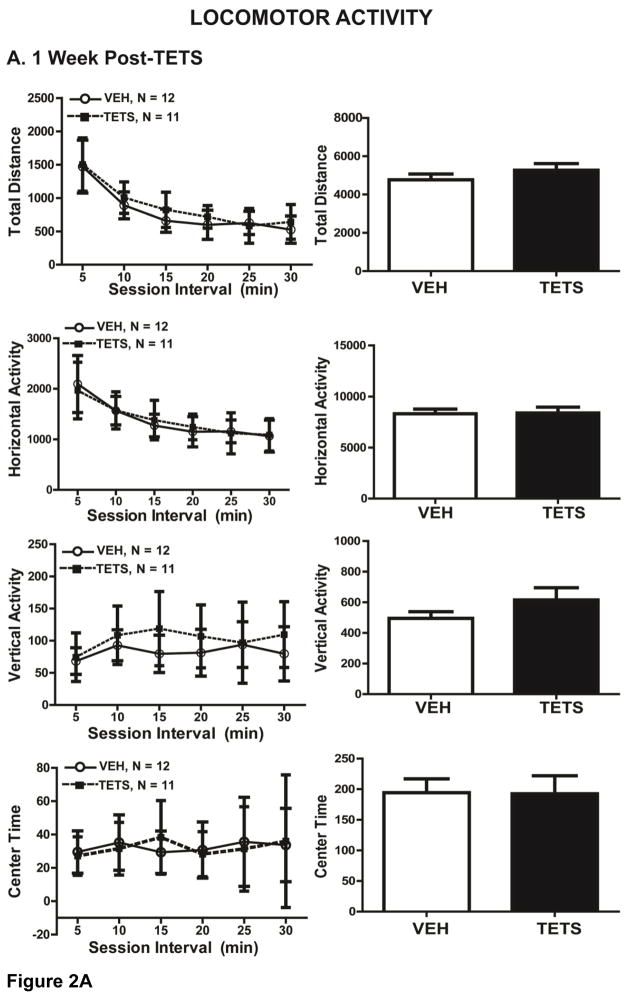
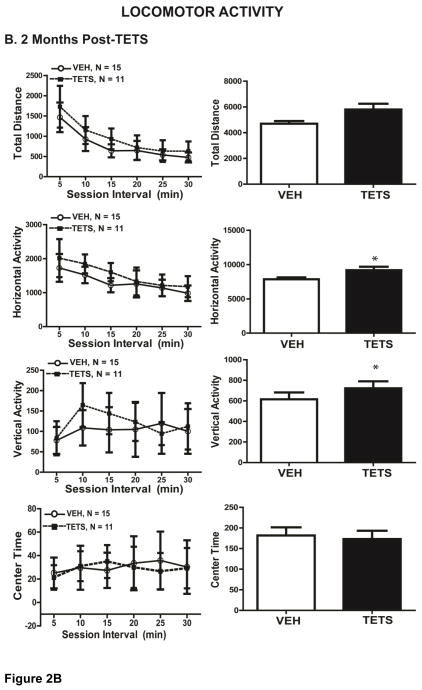
Figure 2. VEH and TETS treated mice exhibited similar open field activity.
Mice injected with TETS or VEH were assessed for open field activity approximately 1 week (A) and 2 months post-exposure (B). Locomotor activity was determined in an open field arena using total distance travelled, horizontal activity, vertical activity and center time and as standard endpoint parameters. The left graph describes each parameter over 5 min time intervals, while the right graph describes total activity over the 30 min testing period. In Figures 2–5, data are presented as the mean ± SD, and the number of mice tested per treatment group appears within the graphs below the respective data. *Indicates statistically significant differences between VEH and TETS treatment groups using Student’s t-test (p < .05).


