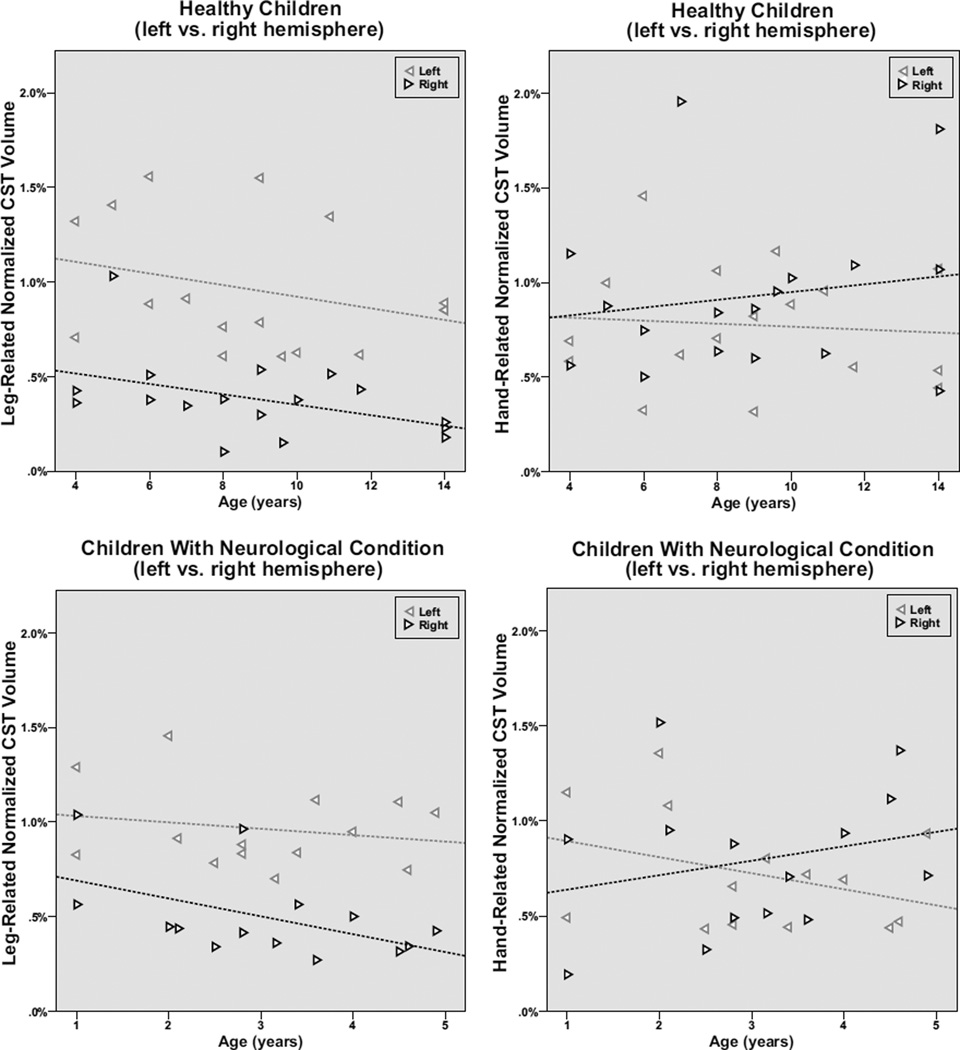
Figure 2.
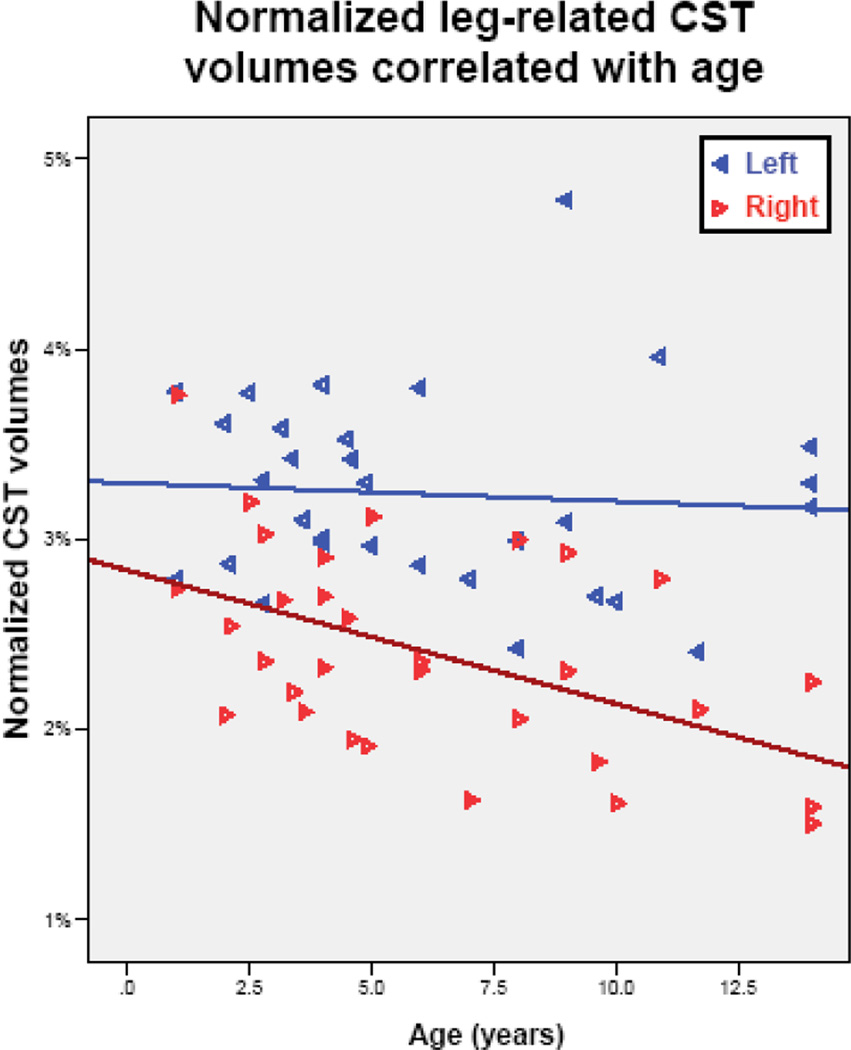
Normalized leg- and hand-related CST volumes correlated with age in the healthy children vs. children with neurological disease. The left CST volumes are represented by the leftward pointing grey triangles, whereas right CST volumes are designated by the rightward pointing black triangles. The leg-related CST showed a consistent left>right asymmetry throughout the age range in the healthy children (p=0.005); the side difference was present but not significant in children with neurological condition. Both the combined group and the two subgroups also showed an age-related decline in the right leg-related CST normalized volumes; this was significant in the combined group (r= −0.46; p=0.01) and showed a strong trend in the smaller subgroups (healthy controls: r= −0.44; p=0.08, children with neurological condition: r=−0.51; p=0.06). In contrast, the hand-related CST segments showed no consistent asymmetry or age-related changes in either subgroup.


