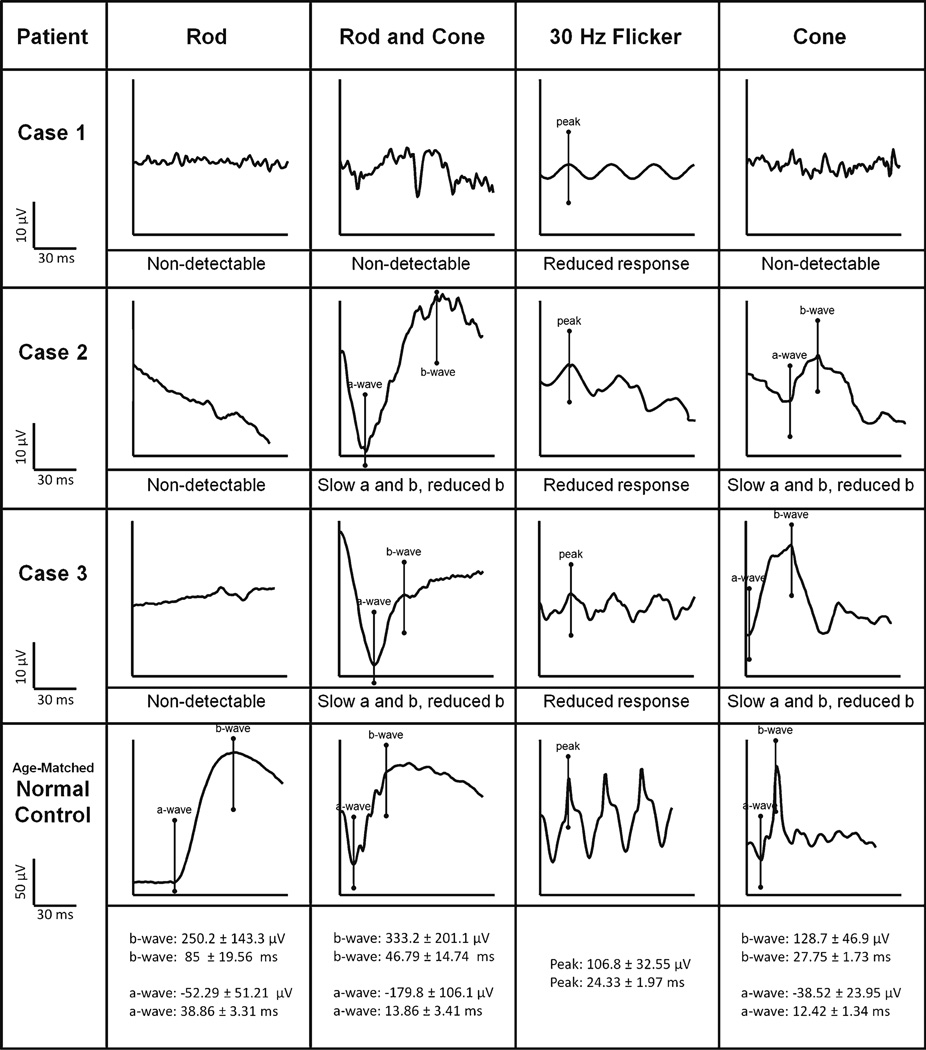
Fig. 4.
ISCEV-standard ERG tracings of each enhanced S-cone study patient. Rod-specific, maximal mixed rod and cone, 30-Hz flicker stimulus, and transient single-cone ERG waveforms are shown. The scales, with normal ranges for each condition, are listed in the bottom row. The ERG responses to a standard single flash (cone) had similar waveforms under photopic (cone) and maximal scotopic conditions, except in waveform amplitude. The 30-Hz flicker stimulus waveforms have reduced amplitudes compared to single flash photopic (cone) a-waves

