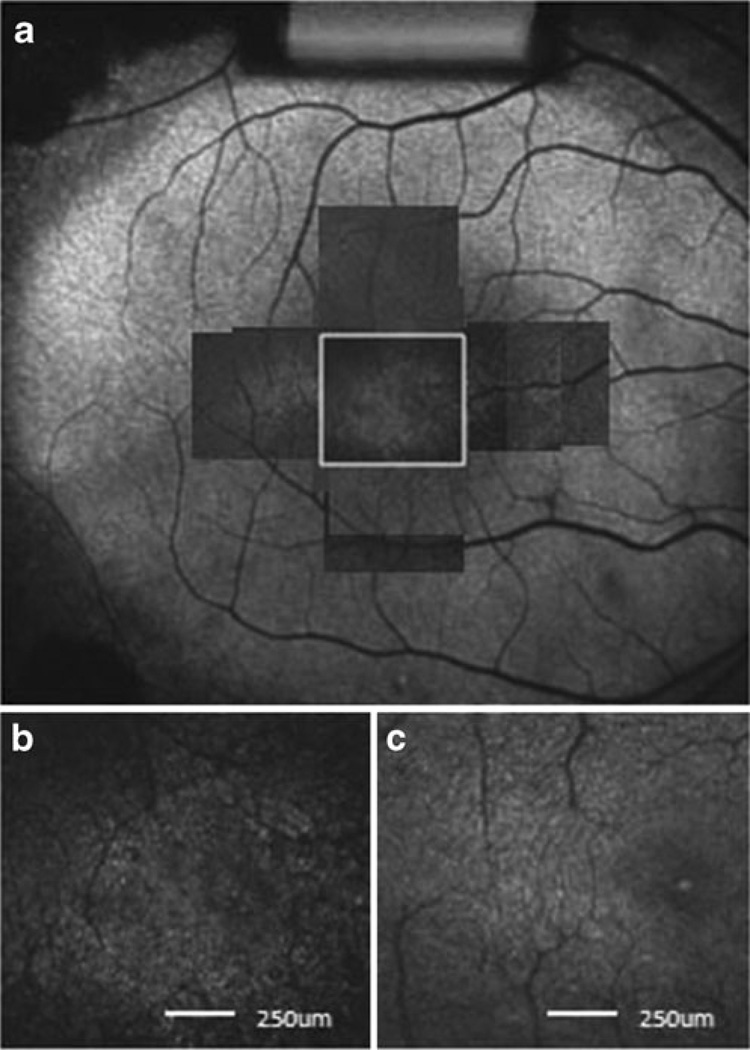
Fig. 5.
The AO-SLO image of patient 1. a A montage of AO-SLO images from patient 1 is matched with the FAF image. b Magnification of the area indicated by the white box in part a. Dark patchy lesions in the central retina can be seen. The scale bar represents 250 µm. c An AO-SLO image from a normal subject at the same location and magnification as shown for patient 1. The image from the normal subject has a regular cone mosaic pattern, and no patchy lesions are visible. Scale bar represents 250 µm

