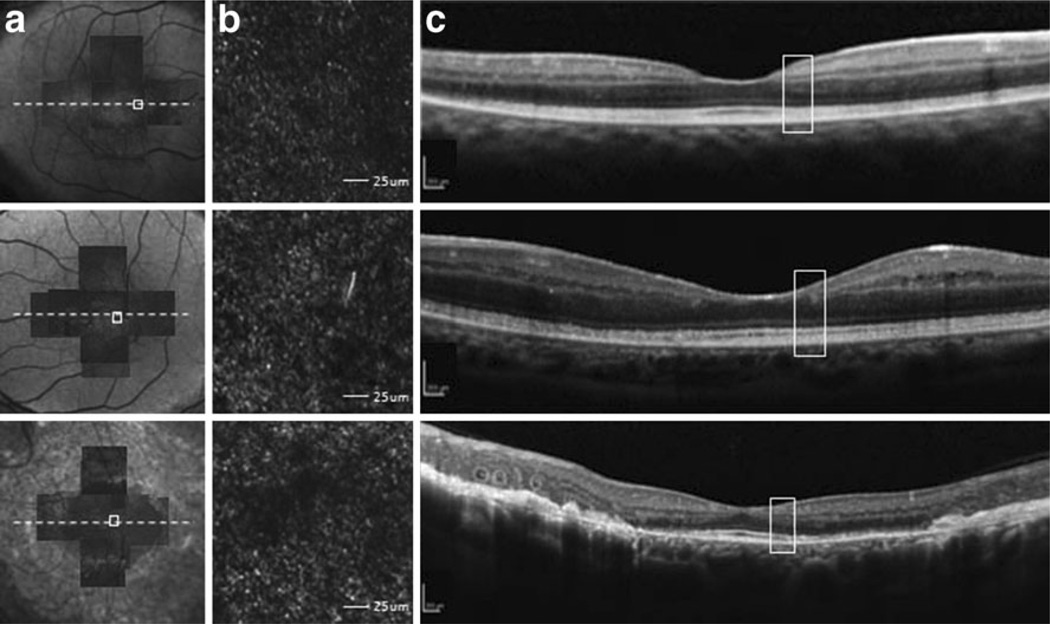
Fig. 7.
Comparison of photoreceptor structure, as represented on AO-SLO and SD-OCT images. a Montage of AO-SLO images from each patient is matched with an FAF or IR image. The location of AO-SLO images, and corresponding SD-OCT sections, is marked. b All AO-SLO images show sparse distribution and large cell size of cones, along with pathognomonic dark lesions. Scale bars represent 25 um. c Areas in SD-OCT images that correspond to AO-SLO images (white box) are shown. An intact inner ellipsoid band indicated that the IS/OS junctions were present, and the OS/RPE line was intact. Scale bars represent 250 µm

