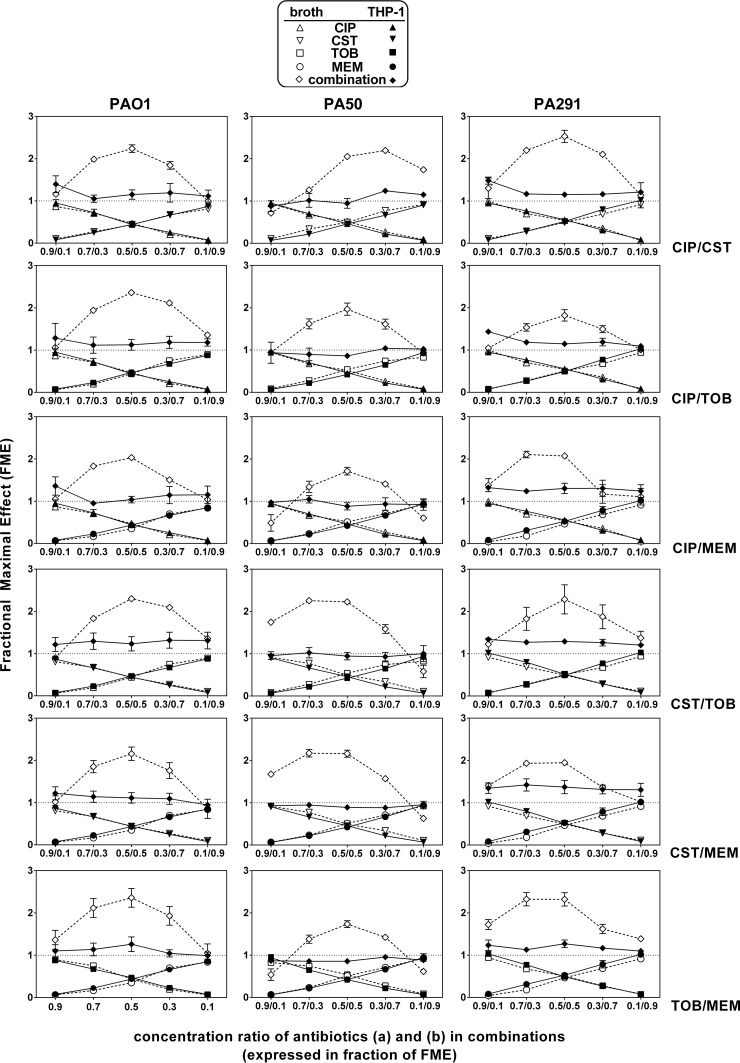
FIG 4.
FME plots of antibiotics against extracellular (open symbols, dashed lines) and intracellular (closed symbols, solid lines) P. aeruginosa strains. In each graph, the abscissa shows the FMEs value calculated for antibiotics A and B based on concentration effects shown in Fig. 1 (see Table 3 for the corresponding concentrations), and the ordinate shows the value of the FMEobs for each antibiotic alone or for the combination. FMEobs values for the combination that are >1 denote a synergistic effect, values equal to 1 an additive effect, values <1 but higher an indifferent effect, and values <1 and lower than FMEobs for each individual antibiotic in the combination an antagonistic effect.

