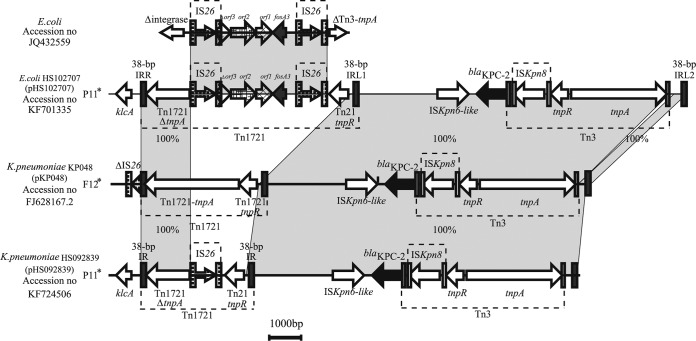
FIG 3.
Comparative analysis of the blaKPC-2 and fosA3 bearing mosaic Tn1721-Tn3-derived transposons present on pHS102707. The genes are depicted as arrows according to the direction of transcription. blaKPC-2 and fosA3 are shown in black and dark gray, respectively. The inverted repeats are indicated by the variable, vertical gray bars. Regions with similar sequences are indicated in gray between the different plasmids. The asterisk indicates that the plasmid type was determined by the degenerate primer MOB typing (DPMT) method (25).

