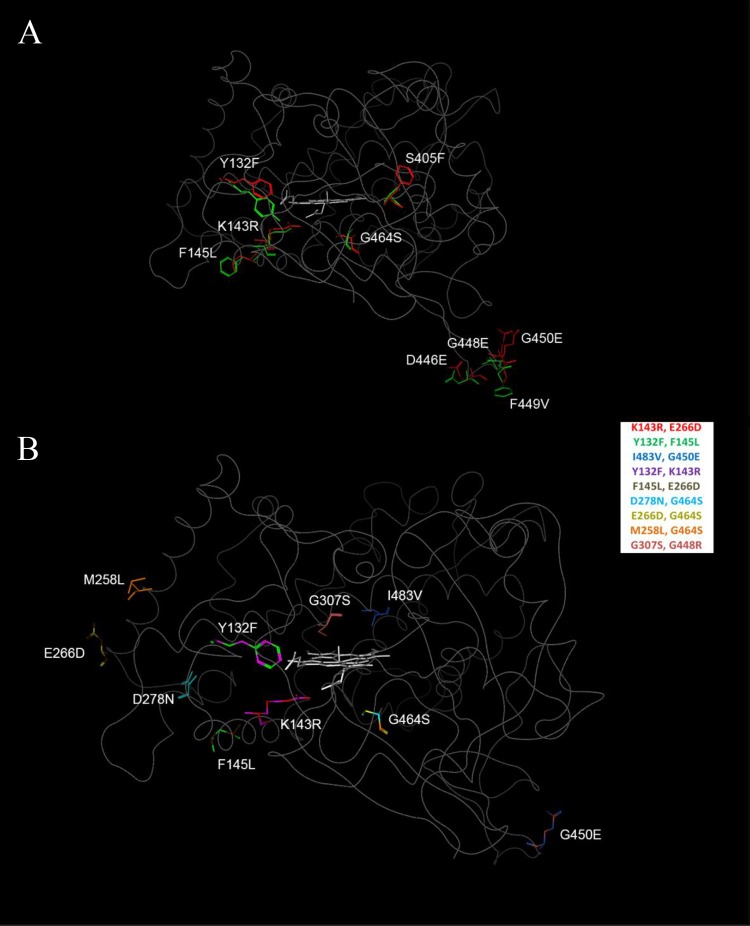
FIG 3.
Mapping of mutant positions on the predicted structure for wild-type Cyp51. (A) The sequence variations in the single mutants characterized in this study are shown, with wild-type residues shown in green stick format, variant residues shown in red stick format, and heme shown in gray stick format. (B) The co-occurring sequence variations in the double mutants are shown with various colors, as identified in the legend box.

