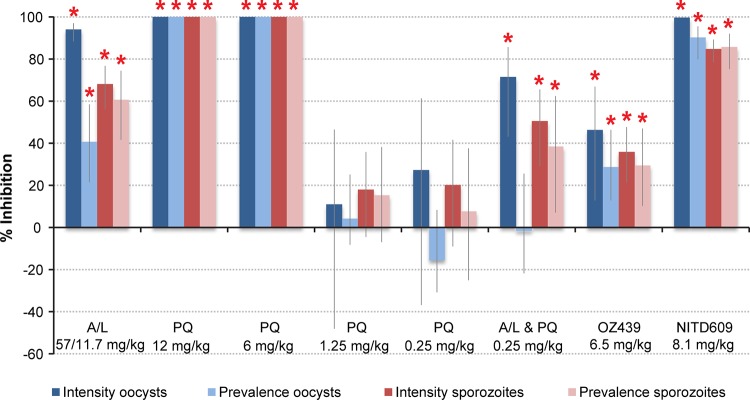
FIG 2.

Transmission-blocking effect of drug treatments within the mosquito vector. Inhibition of oocyst intensity and prevalence (dark- and light-blue bars, respectively) and sporozoite intensity and prevalence (dark- and light-red bars, respectively) in the mosquito vector after feeding on drug-treated infected mice. Vertical lines denote 95% confidence interval estimates. Inhibition was calculated relative to the no-drug control. Red asterisks indicate statistically significant (P < 0.05) levels of inhibition.
