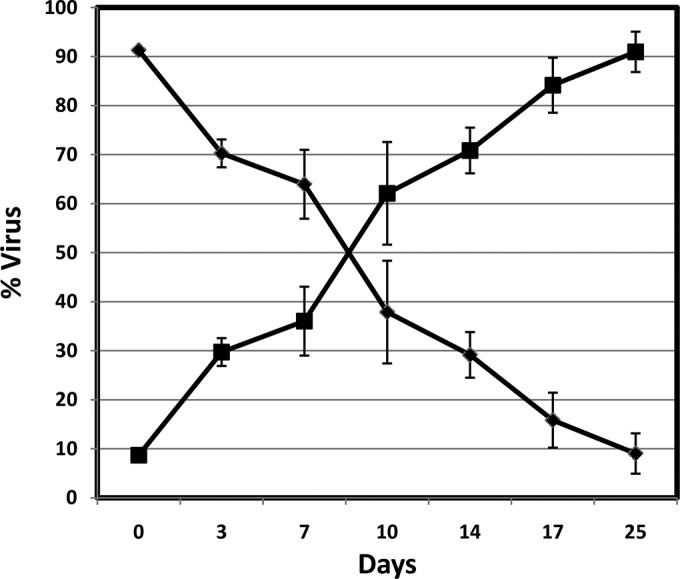
FIG 2.

Relative prevalence of WT and V106A mutant viruses in cultures from the replication capacity study. Solid diamonds represent the V106A mutant virus, and solid squares represent the WT virus. The experiment was conducted in triplicate, and the error bars represent standard deviations.
