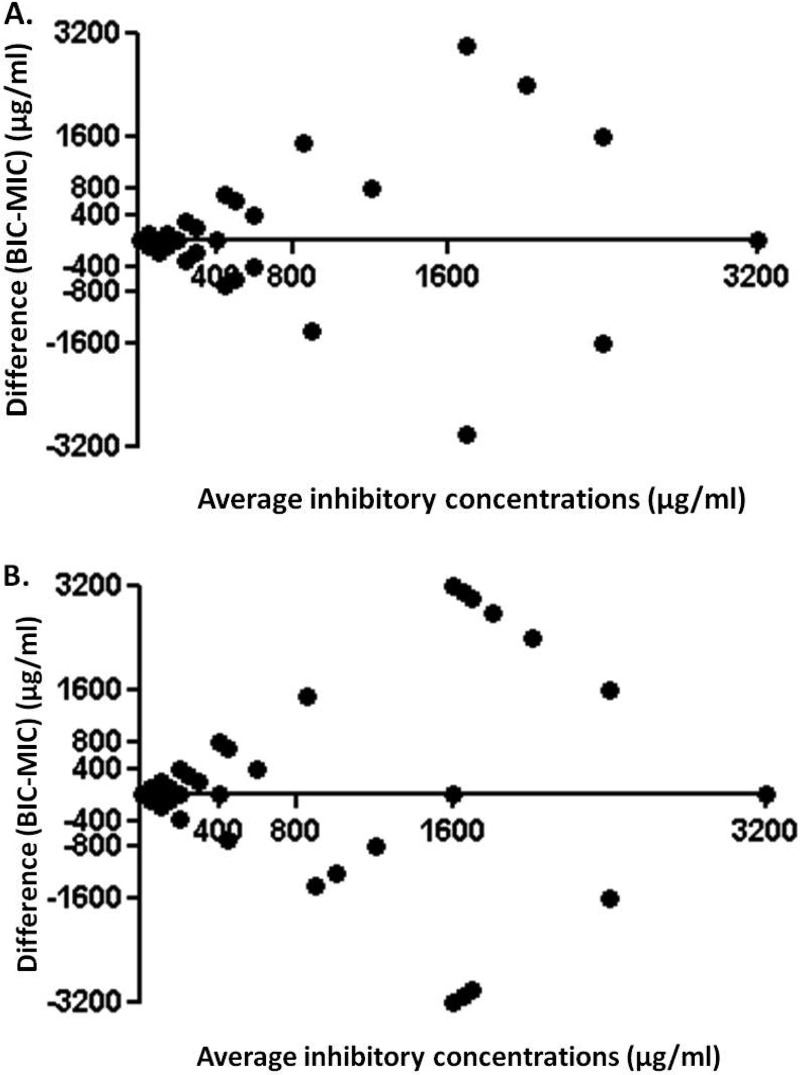
FIG 2.
Bland-Altman plots of average inhibitory concentrations versus difference between biofilm inhibitory concentrations (BICs) and MICs for Burkholderia cepacia complex (A) and Stenotrophomonas maltophilia (B) cystic fibrosis isolates, with points on the x axis (y = 0) indicating complete agreement.

