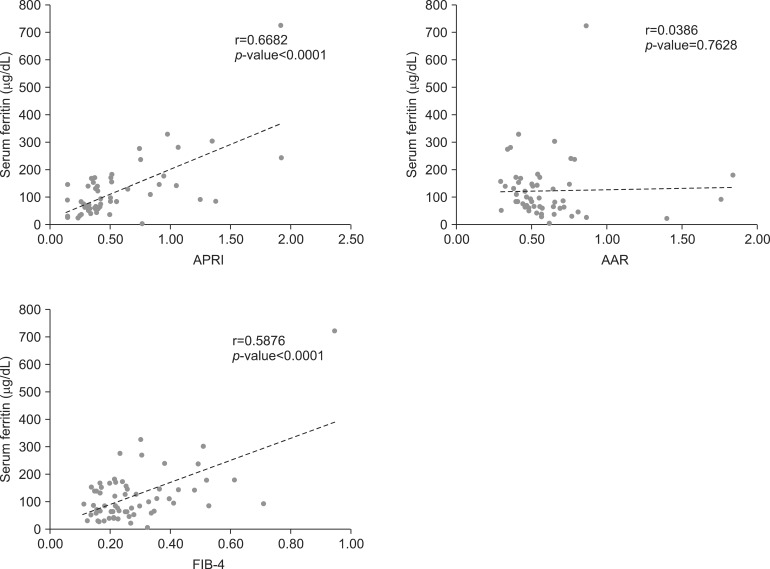
Fig. 1.
(A) Scatter plot between APRI and serum ferritin. (B) Scatter plot between AAR and serum ferritin. (C) Scatter plot between FIB-4 and serum ferritin. The scatter plot of APRI and FIB-4 tended to increase as the serum ferritin increased significantly (p<0.0001 and p<0.0001, respectively). AST: aspartate aminotransferase, APRI: AST to platelet ratio index, ALT: alanine aminotransferase, AAR: AST/ALT ratio, FIB-4: fibrosis-4.

