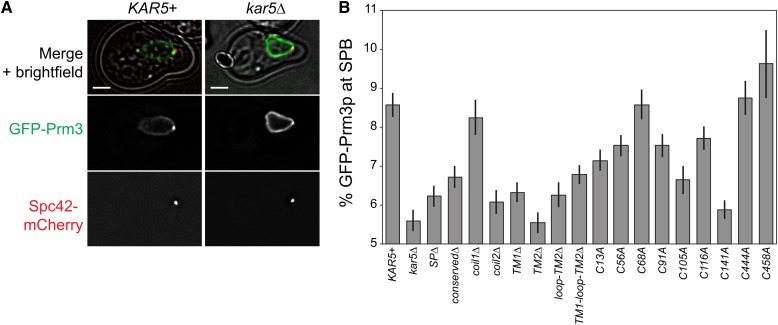
Figure 2.
Prm3p enrichment assay in kar5 mutants. (A) Representative example of GFP-Prm3p recruitment to the SPB (marked by Spc42-mCherry). The merged panels include a transmitted light image. GFP images are displayed at the same brightness. Scale bar, 2 μm. (B) Percent of total GFP-Prm3p present near the SPB (see the section Materials and Methods for details on quantification) for the indicated genotypes in alpha-factor−treated cells (~2 hr, 30°). Strains used are MS8389 plus the indicated CEN plasmids. Average and ± SEM are shown. Data are pooled from two independent experiments. GFP, green fluorescent protein.

