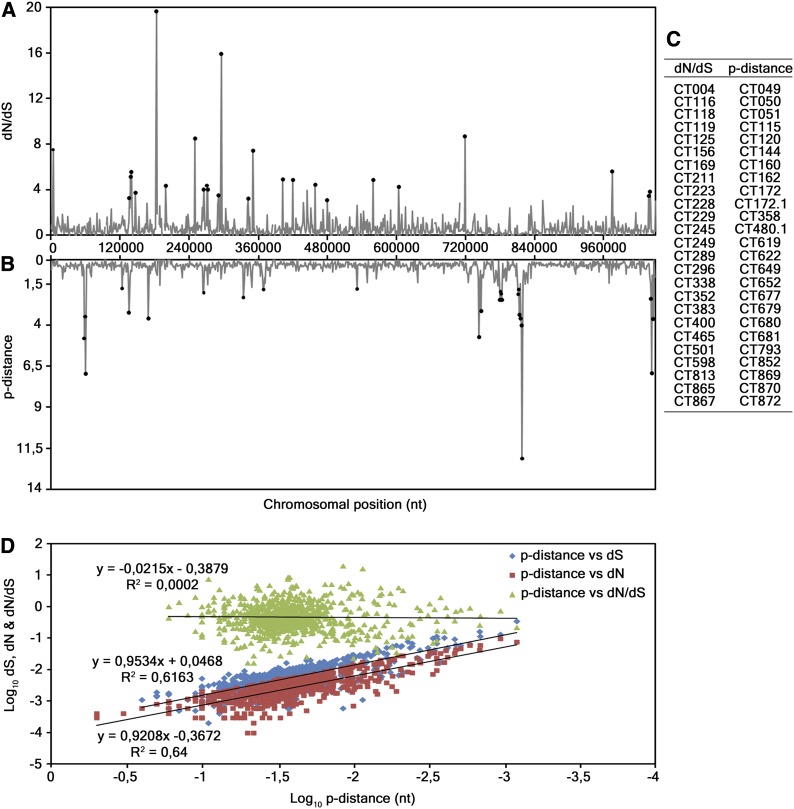
Figure 1.
Evaluation of the association between polymorphism and dN, dS and dN/dS. (A and B) Distribution of dN/dS and p-distance values, respectively, obtained from the analyses of all the 874 genes from the 53 strains. The horizontal axis represents the C. trachomatis chromosomal positions where genes are placed in their chromosomal order, from the CT001 to the CT875 (genes names and positions according to D/UW-3/CX strain annotation). (C) 25 genes (ordered by their relative chromosomal position) that display the greater values for both analyses, which are representative of the lack of correlation between dN/dS and polymorphism. (D) Scatter plots of p-distance vs. dN, dS, and dN/dS, on a log-scale for clarity. The Pearson’s product moment correlation coefficient for p-distance vs. dN, dS, and dN/dS are R = 0.92, R = 0.9, and R = 0.02, respectively.

