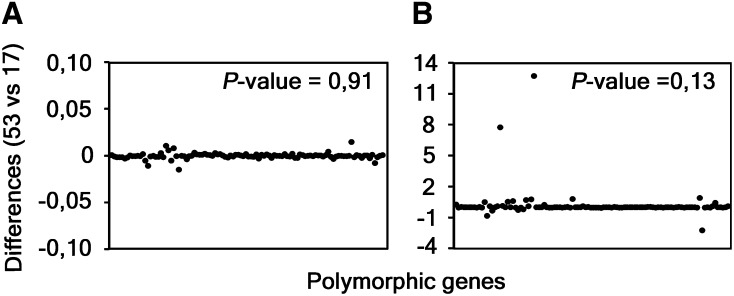
Figure 3.
Differences obtained during the analyses using 53 and 17 strains. The graphs show the differences obtained between the results of the p-distance (A) and the dN/dS (B) analyses of all the 53 and the set of 17 strains (representative of the majority of the tree branches). Each black dot represents one of the 100 polymorphic genes selected for these comparisons. P-values were calculated through the paired two-tailed t-test.

