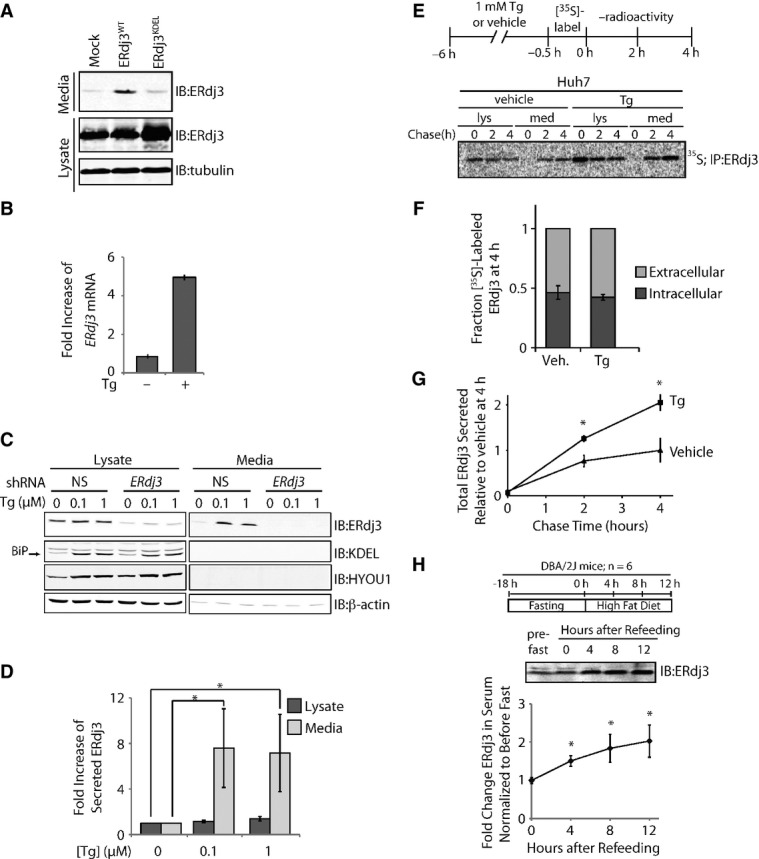
Figure 1. ER stress increases ERdj3 secretion.

- A Immunoblot of media and lysate collected from HEK293T cells overexpressing ERdj3WT or ERdj3KDEL. Fresh media was conditioned on cells for 24 h prior to harvest.
- B qPCR analysis of ERdj3 mRNA in HEK293T cells treated with or without thapsigargin (Tg; 6 h, 100 nM). Error bars represent the mean ± 95% confidence interval as calculated in DataAssist 2.0 (n = 3).
- C Representative immunoblot of lysates and media collected from HEK293T-Rex cells stably expressing non-silencing (NS) or ERdj3 shRNA. Cells were treated with the indicated concentration of Tg in fresh media for 16 h.
- D Quantification of the fold increase of ERdj3 in lysates and media collected from HEK293T-Rex cells treated with the indicated concentration of Tg in fresh media for 16 h as in (C). *P < 0.05; n = 3, mean ± SEM.
- E Representative autoradiogram of [35S]-labeled ERdj3 in lysates and media collected from Huh7 cells incubated in the presence or the absence of Tg (1 μM). The experimental paradigm for labeling is shown above.
- F Quantification of fraction intracellular (dark gray) and extracellular (light gray) [35S]-labeled ERdj3 following a 4 h chase relative to total [35S]-labeled ERdj3 at 4 h (as shown in E). Error bars represent the standard error from biological replicates (n = 3).
- G Quantification of total [35S]-labeled ERdj3 in media collected from cells pretreated with vehicle or Tg, as shown in (E). The media [35S]-labeled ERdj3 was measured by densitometry and is normalized to the amount of media [35S]-labeled ERdj3 at 4 h from vehicle-treated cells. *P-value < 0.05; n = 3, mean ± SEM.
- H Representative immunoblot and quantification of sera collected at the indicated times from DBA/2J mice fed a high-fat (60% fat) diet after a 18 h fast. A schematic of the fasting/refeeding experimental setup is shown above. The quantification was normalized for each mouse to the amount of ERdj3 in the serum draw immediately prior the fast. *P-value < 0.05; n = 6, mean ± SEM.
Source data are available online for this figure.
