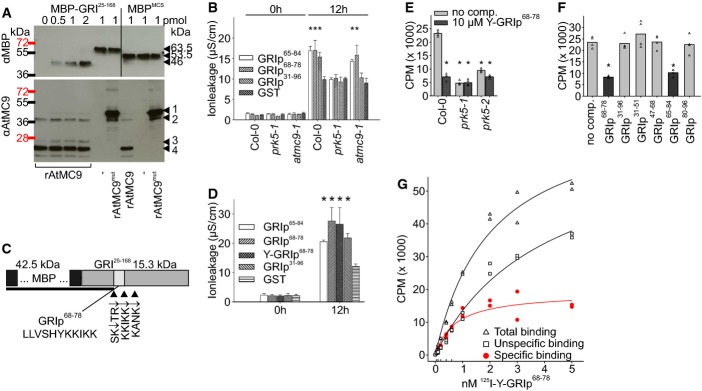
Figure 4. Processing of GRI-peptide by METACASPASE-9 is required for induction of elevated ion leakage.

- Recombinant AtMC9 (rAtMC9) cleaved GRI25–168 in vitro. Bacterially produced MBP-GRI25–168 (from 0 to 2 pmol left to right) was incubated with 1 pmol rAtMC9 or inactive rAtMC9mut (rAtMC9C147AC29A), and cleavage products were analyzed by Western blot with anti-MBP and anti-AtMC9 antibodies. Arrowheads in the anti-MBP blot (from top to bottom) indicate MBP-GRI25–168 (63.5 kDa), MBPMCS (53.5 kDa), rAtMC9-cleaved MBP-GRI25–168 (46 kDa). Arrowheads in the anti-AtMC9 blot indicate: 1: N-terminal domain + p20 + p10 subunits of AtMC9, 2: p20 + p10 subunits of AtMC9, 3: N-terminal domain + p20 subunit of AtMC9, 4: p20 subunit of AtMC9.
- Infiltration of wild-type, prk5-1 and atmc9-1 leaves with 37 nM GRIp31–96, GRIp65–84, GRIp68–78 or GST. GRIp65–84 and GRIp68–78 but not GRIp31–96 were able to induce elevated ion leakage in the atmc9-1 mutant.
- Schematic representation of the GRI and the cleavage sites for rAtMC9. The cleavage product detected in Western blot analysis with anti-MBP antibody is shown as black bar. Mass spectrometric analysis of MBP-GRI25–168 cleavage with rAtMC9 provided evidence for cleavage after SKTR and KANK; further analysis of GRIp31–96 cleavage by rAtMC9 provided evidence for cleavage after SK, SKTR and after KKIKK. The position of the resulting 11-aa-long peptide (68LLVSHYKKIKK78) is indicated by a white inset.
- Infiltration of Col-0 leaves with 37 nM of GRIp65–84, GRIp68–78, Y-GRIp68–78, GRIp31–96 or GST. Y-GRIp68–78 showed similar activity in cell death induction compared to the other GRI-derived peptides.
- 125I-labeled Y-GRIp68–78 (0.46 nM) bound specifically to Col-0 membrane fractions (light gray bars), the binding was significantly reduced in prk5-1 and prk5-2 plants. Excess of non-radioactive Y-GRIp65–84 (10 μM) reduced binding to background levels (dark gray bars; all bars show the average of four samples, triangles show individual data points).
- Excess of GRIp68–78 and GRIp65–84 (10 μM) but not of GRIp31–96 or other peptides (GRIp31–51, GRIp47–68, GRIp80–96) competed the binding of 0.46 nM 125I-Y-GRIp68–78 to membrane extracts from Col-0 (all bars show average of four samples, triangles show individual data points).
- Saturation binding curve for 125I-Y-GRIp68–78 to Col-0 membrane extracts. Specific binding was calculated by subtracting non-specific binding from the total binding. The affinity of 125I-Y-GRIp68–78 to the receptor (Kd = 1.9 nM) was calculated by non-linear regression analysis. Scatchard plot is shown in Supplementary Fig S17.
Data information: Data in (B) and (D) are shown as average ± SD of four replicates consisting of four leaf disks each. Asterisks in (B) and (D) mark statistically significant differences from infiltration with GST according to Sidak’s test (P < 0.05). Asterisks in (E) and (F) mark statistically significant differences from peptide binding to Col-0 membrane fractions without competitor according to Sidak’s test (P < 0.01). All experiments were repeated three times with similar results. Source data are available online for this figure.
