Figure 2.
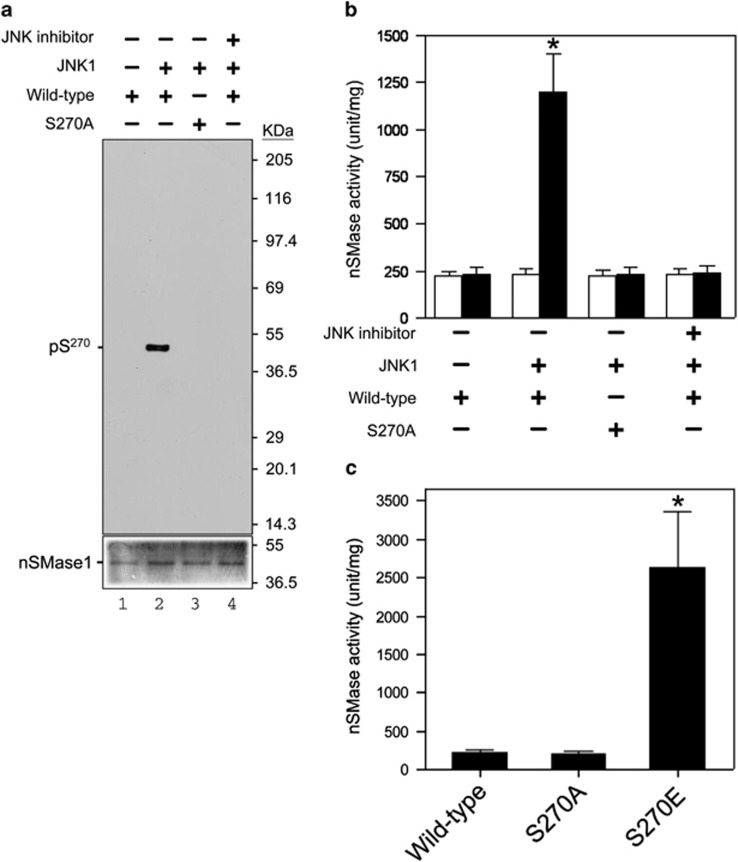
Phosphorylation and activation of nSMase1 by JNK in vitro. (a) The serine-270 phosphorylation of nSMase1 by JNK in vitro. Mouse JNK1 was used for an in vitro kinase assay using [γ-32 P]-ATP and either nSMase1 (wild-type) or mutant protein (S270A) as the substrate. The reactions were incubated at 30 °C for 30 min with or without 2 ng of mouse JNK1 and in the presence (+) or absence (−) of 10 μM SP600125. Recombinant proteins from each reaction were separated on 10% SDS-polyacrylamide gels and transferred to PVDF membranes. Phosphorylated nSMase1 was detected by autoradiography (upper panel). The levels of substrate protein present in each reaction was determined using Coomassie Brilliant Blue R-250 staining (lower panel). (b) The effect of phosphorylation on the activation of nSMase1. The nSMase activity in each column is shown. After the in vitro kinase assay, the postreaction mixture was analyzed in an nSMase enzymatic assay using C6-NBD-sphingomyelin (black columns). White columns indicate the basal enzyme activity before the kinase assay. The basal enzyme activities of the recombinant nSMase1 (wild-type) and nSMase1 mutant (S270A) were 22.4±0.48 and 22.6±0.35 μmol/mg/h, respectively. Column 1, nSMase1 wild-type; column 2, nSMase1 treated with JNK; column 3, nSMase1 mutant (S270A) treated with JNK; column 4, nSMase1 treated with JNK in the presence of a JNK inhibitor. The enzyme activity after JNK treatment (black column 2) was 120.1±21.4 μmol/mg/h. Each value represents the mean of three independent experiments, and the error bars represent the S.D.s. *P<0.01 versus the wild-type. (c) Activities of the wild-type and S270A and S270E nSMase1 mutants. The nSMase activities of the recombinant proteins were determined using C6-NBD-sphingomyelin. Column 1, recombinant nSMase1 (wild-type); column 2, S270A mutant (S270A); column 3, S270E mutant (S270E). The activity of the S270E mutant (column 3) was 237.8±81.7 μmol/mg/h. Each value represents the mean of three independent experiments, and the error bars represent the S.D.s. *P<0.01 versus basal enzyme activity (white column 2)

