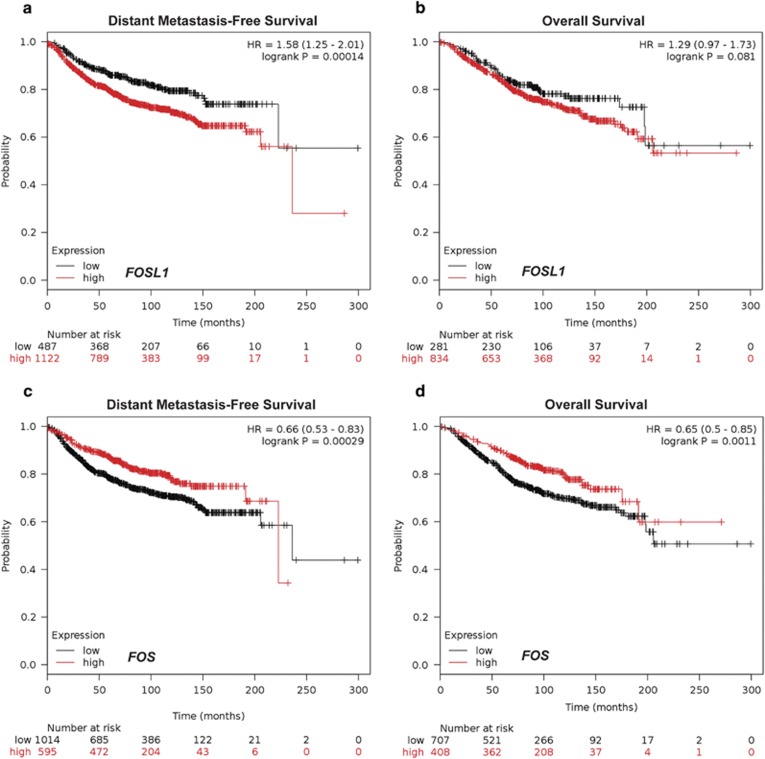
Figure 1.
Prognostic value of FOSL1 and FOS expression in breast cancer patients. (a) Correlation of the levels of FOSL1 and FOS expression and prognosis in human breast cancer patients using the Kaplan–Meier (KM) plotter integrative data analysis tool;24 http://www.kmplot.com. Shown are KM survival plots for patient samples classified as having high (red) or low (black) (a and b) FOSL1 or (c and d) FOS median expression to assess metastasis-free (DMFS: a, c) or overall (OS: b, d) survival. Hazard ratio (HR) with 95% confidence intervals and log-rank P-value are displayed, and the number of patients at risk in the high and low groups are indicated for each time point. The total number of patients with available clinical data is: DMFS, n=1609; and OS, n=1105

