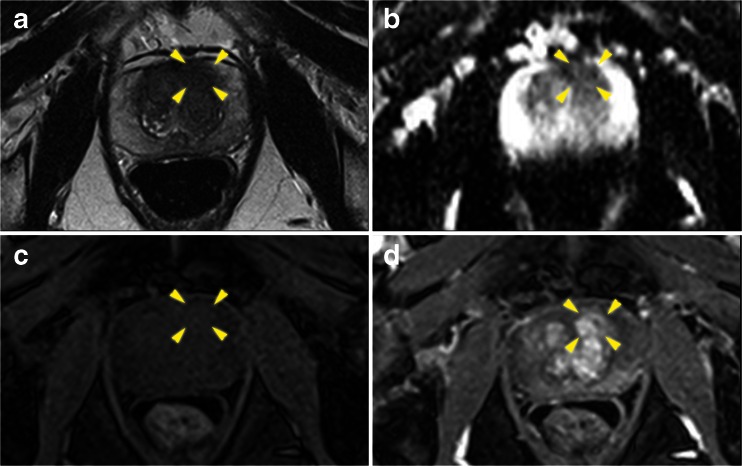
Fig. 3.
Axial multi-parametric MR images [(a) T2 weighted, (b) Apparent diffusion coefficient map, (c) pre-contrast T1, and (d) early post contrast T1] of a left anterior apical region (yellow arrows) Pi-RADS score 3/5. Template mapping biopsy revealed definition one tumour within the corresponding Barzell zones (1 and 7)

