Figure 4.
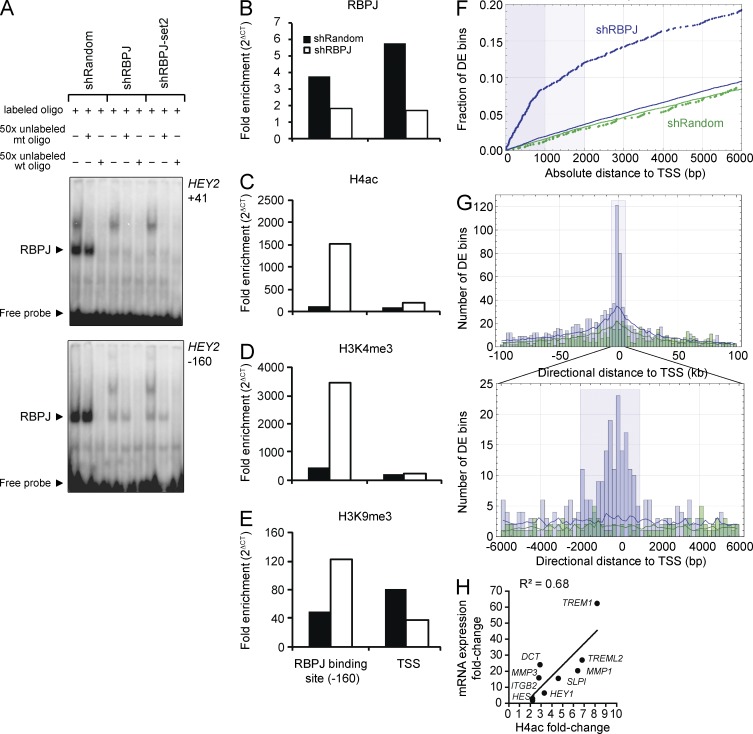
RBPJ depletion in MDA-MB-231 cells results in histone changes corresponding to promoter activity. (A) EMSA was performed using MDA-MB-231 nuclear lysates (n = 1) and labeled probes representing two RBPJ binding sites in the HEY2 promoter (HEY2: −160 to −167 and +41 to +48 bp from the TSS) in the absence or presence of excess unlabeled mutated probe (+mt) or excess wild-type probe (wt). Comparable results were obtained using binding sites in the HEY1 promoter (not depicted). (B–E) ChIP analysis of the HEY2 promoter (n = 1) with fold enrichment calculated as 2(Ct IgG − Ct target). Bound fragments were quantified by RT-qPCR with primers spanning the −160 bp RBPJ binding site in the promoter and the TSS. (B) RBPJ ChIP. (C) H4ac ChIP. (D) H3K4me3 ChIP. (E) H3K9me3 ChIP. (F and H) Locations of genome-wide 500 bp H4ac-differentially enriched regions identified by ChIP-seq (corrected P ≤ 0.005) relative to 38,405 nonredundant UCSC gene TSSs. Solid lines show random expectations (n = 20) for shRBPJ (blue) and shRandom (green). (F) Empirical distribution functions for the distance from the nearest TSS to the center of a differentially enriched (DE) region in the shRBPJ (blue) and the shRandom (green) control. Shaded blue regions that extend to 1 and 2 kb mark distances within which, for shRBPJ data, differentially enriched regions are spatially concentrated relative to TSSs. (G) Overview (±100 kb) and detailed (±6 kb) histograms of directional distance between a differentially enriched region center and its nearest TSS. The shaded blue rectangle in the detailed view marks the −2/+1 kb TSS regions used in analyses. (H) Fold change in the H4ac signal correlates with fold change in mRNA expression (RT-qPCR) evaluated for a subset of the 114 TSSs that were significantly differentially enriched in the knockdown relative to shRandom cells, which correspond to 1 (Pearson correlation P = 0.006).

