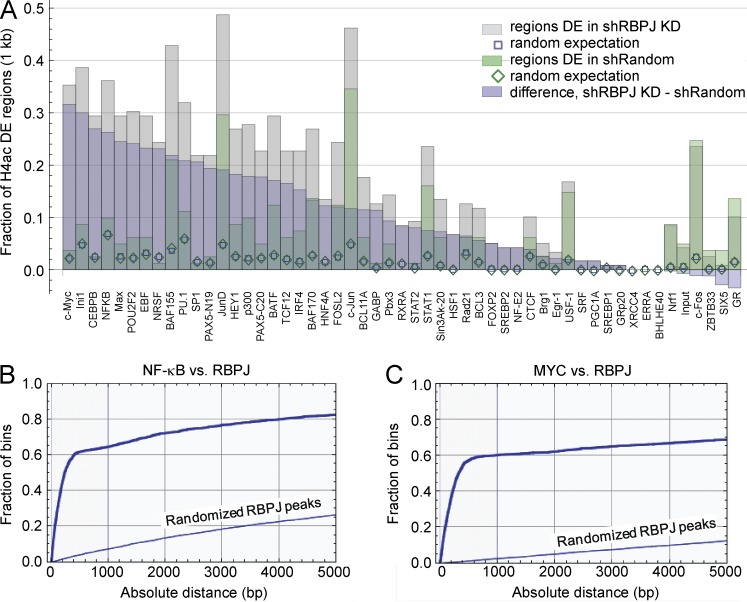
Figure 7.
MYC and NF-κB binding regions are associated with H4ac changes and are near RBPJ binding regions. (A) Spatial association between genome-wide 500 bp H4ac regions in MDA-MB-231 cells and ENCODE ChIP-seq data for 52 transcription factors and input DNA in 24 cell lines (Birney et al., 2007). The bar chart shows the fractions of H4ac differentially enriched (DE) regions with centers within 1 kb of the center of an enriched transcription factor region. (B and C) Concordance between RBPJ ChIP-Seq peaks and NF-κB and MYC binding regions. Spatial relationship between 2112 ChIP-seq enriched RBPJ peaks in CUTLL cells (Wang et al., 2011) and ChIP-seq enriched regions reported for NF-κB p65 (B) and MYC (C) in ENCODE data (Birney et al., 2007). Empirical distribution functions for distances between the center of a thresholded ENCODE peak and the center of the nearest RBPJ peak region, contrasted to the distribution function when RBPJ peak locations on each chromosome were randomized.

