Figure 4.
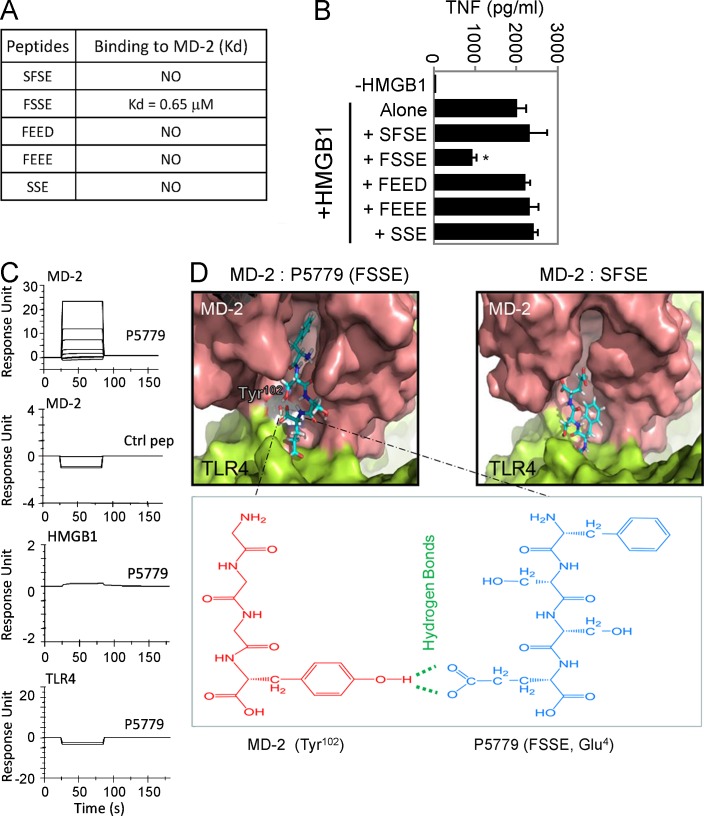
Screening for HMGB1 inhibitors. (A) SPR analysis was performed to test the interaction of MD-2 (coated on the chip) with P5779 (FSSE) and other peptides (100 nM). Kd values are shown. Data are representative of three experiments. (B) Primary human macrophages were stimulated in vitro with HMGB1 (1 µg/ml) plus different peptides (50 µg/ml) for 16 h, and TNF release was measured by ELISA. Data are presented as means ± SEM. *, P < 0.05 versus HMGB1 alone. n = 4–5 experiments. (C) SPR analysis was performed to measure binding of P5779 (12.5, 25, 50, and 100 nM) or scrambled control (ctrl) peptide (100 nM) to human MD-2 (Kd = 0.65 µM for P5779), HMGB1, or TLR4 (coated on the chip). Data are representative of three experiments. (D) Schematic illustration showing molecular docking of MD-2 with tetramer peptides FSSE (left) and SFSE (right). The pink area represents the surface of the peptide-binding pocket of MD-2, and the green area denotes the TLR4 protein surface. The bottom panel shows hydrogen bonds and van der Waals interactions. P5779, with a stronger van der Waals interaction than control, is fully extended into the hydrophobic pocket of MD-2 and forms an additional hydrogen bond with Tyr102 of MD-2.

