Abstract
Purpose
To evaluate the effect of powerless contact lens on improving the quality of optical coherence tomography imaging of rodent retina.
Methods
A spectral-domain optical coherence tomography (SD-OCT) system was built for in vivo imaging of rodent retina. The calibrated depth resolution of the system was 3 μm in tissue. A commercial powerless contact lens for rat eye was tested in the experiments. For each rat eye, the retina was imaged in vivo sequentially first without wearing contact lens and then with wearing contact lens. The lateral resolution and signal-to-noise ratio of the OCT images with and without contact lens were compared to evaluate the improvement of image quality.
Results
The fundus images generated from the measured 3D OCT datasets with contact lens showed sharper retinal blood vessels than those without contact lens. The contrast of the retinal blood vessels was also significantly enhanced in the OCT fundus images with contact lens. As high as 10 dB improvements in SNR was observed for OCT images with contact lens compared to the images of the same retinal area without contact lens.
Conclusions
We have demonstrated that the use of powerless contact lens on rat eye can significantly improve OCT image quality of rodent retina, which is a benefit in addition to preventing cataract formation. We believe the improvement in image quality is the result of partial compensation of the optical aberrations of the rodent eye by the contact lens.
Keywords: Contact lens, optical coherence tomography, resolution improvement, retinal imaging
INTRODUCTION
Optical coherence tomography (OCT) is a low coherence interferometry based noninvasive microscopic imaging technology, which has undergone fast development in the past two decades.1–3 Since the development of spectral-domain (SD) detection technique, OCT is rapidly becoming an indispensable non-invasive imaging modality for the diagnosis and treatment monitoring of various ocular diseases in human.4,5 SD-OCT has also been widely used to image the eye of animals including small animal models of various retinal diseases.6–12 By providing unprecedented in vivo high-resolution visualization of the retinal structures small animal ophthalmic OCT has enabled the study of the time course of retinal diseases using the same animal. We anticipate that with the development of automatic segmentation software and more user friendly interface OCT will play a more and more important role in ophthalmic research. However, the diagnostic capability of OCT in both clinical applications and research highly depends on its image quality.
In addition to the dependence on the technology of an OCT machine, the imaging quality of retina, e.g. lateral resolution and signal-to-noise ratio (SNR), also depends on the optical properties of the anterior segment of the eye including its optical aberrations and transparency. Optical aberrations have been recognized as the ultimate limiting factor for the achievable lateral resolution of retinal images. To improve the lateral resolution of retinal imaging many groups are working on adaptive optics to correct the optical aberrations of the eye.13–16 Studies have shown that rodent eyes have high amplitude of various orders of optical aberrations.17–20 Application of adaptive optics has successfully improved the lateral resolutions of rodent retinal imaging.16
There is an additional hurdle in achieving high-quality imaging of rodent retina: cataract formation when the animal is anesthetized. To keep the eye transparent during imaging, examination time is required to be short, and artificial tears need to be applied to the cornea repeatedly.6 However, even with the application of artificial tears in our experiments cataract can still occur when the imaging time lasts longer (e.g. more than 10 min). To solve this problem powerless contact lenses have been used in imaging rodent retina with various imaging modalities.21,22
Contact lenses may have additional benefits for imaging the rodent retina. Gesine et al. used a custom-made contact lens (focal length: 10 mm) to reduce the risk of corneal dehydration and edema and to act as a collimator.23 In a previous human study, prescribed contact lens was used to partially compensate for corneal aberrations of human eye for adaptive optics scanning laser ophthalmoscopy.14,24 Srinivasan et al. found that imaging small animal eye with a “contact lens” made from a flat microscope coverslip and hydroxypropyl methylcellulose can effectively remove the refractive power of the air–corneal interface and the aberrations from irregularities in the cornea while maintaining corneal hydration and clarity during imaging.20 However, since this type of “contact lens” is used to cancel the refractive power of the eye it is incompatible with standard retinal imaging techniques.
We used a powerless contact lens on rat’s eye to slow cataract formation in OCT imaging experiments. We found that the retinal OCT images had better quality after applying a contact lens. The purpose of this study is to verify our observations by directly compare the OCT images of rat retina acquired with and without a contact lens.
METHODS
Experimental System
A schematic of the experimental system is shown in Figure 1. A three-module superluminescence diode (SLD, T-840 Broadlighter, Superlum Diodes Ltd., Moscow, Russia) with a center wavelength of 840 nm and full-width-half-magnitude (FWHM) bandwidth of 100 nm is used in the system, which can achieve a depth resolution of ~3 μm in tissue. In the sample arm, the light was collimated, scanned by an X–Y galvanometer scanner, and then focused by an achromatic lens (L1, f = 75 mm). For imaging the retina in vivo, an ocular lens (L2, f = 19 mm) was added. The light beam was collimated after L2 and focused onto the retina by the anterior segment of the eye. In the detection arm, the reflected light from the sample and reference arms was collimated and detected by a spectrometer, which consists of an 1200 line/mm transmission grating, a multi-element imaging lens (f = 150 mm), and a line scan CCD camera (AVIIVA EM4 2 k 4 × 12bits, 2048 pixels with 14 micron pixel size, e2V). An image acquisition board (NI PCI-1429) acquired the image data captured by the camera and transferred them to a computer for signal processing and image display.
FIGURE 1.
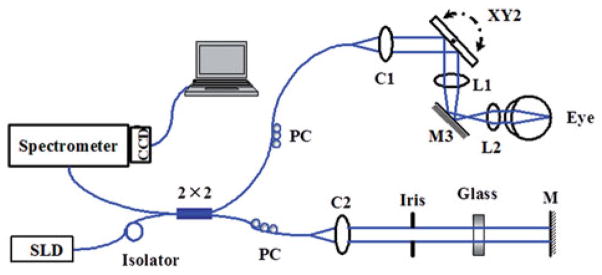
Schematic of the experimental OCT system. M: mirror; C1, C2: collimator; L1, L2: lens; PC: polarization controller.
Animal Imaging
To evaluate the effect of contact lens on OCT retinal imaging, the system was applied to imaging the normal rat retina in vivo. The animal (Sprague Dawley rat, body weight: 450 g, Charles Rivers) was anesthetized by intraperitoneal injection of a cocktail containing ketamine (54 mg/kg body weight) and xylazine (6 mg/kg body weight). The pupil was dilated with 10% phenylephrine solution. All experiments were performed in compliance with the guidelines of the University of Southern California’s Institutional Animal Care and Use Committee. When no contact lens is used, drops of artificial tears were applied to the eyes every 2 min to prevent dehydration of the cornea and cataract formation. After anesthetization, the animals were restrained in a mounting tube, which was fixed on a five-axis platform. The light power in front of the eye was about 900 μW, which is below the ANSI safety limits for eye imaging.25 The rat eye was first imaged without contact lens. The image quality on the real-time display was optimized by adjusting the ocular lens. Immediately after the imaging we put a few drops of artificial tears onto a powerless contact lens (Cantor + Nissel, PMMA 2.70/5.20, radius of curvature of the central optic zone: 2.70 mm; diameter: 5.20 mm) and put it on the imaged eye gently. During this procedure, we tried our best to keep the eye in the same position. We then acquired another set of retinal OCT images. With contact lens we put no artificial tears on the eye during the imaging procedure. After all the images were acquired we post-processed them for analyses.
RESULTS
Image Overview
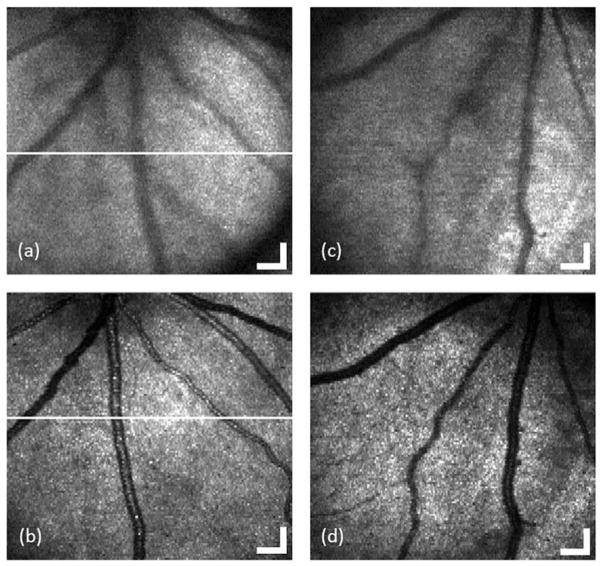
Figure 2(a–d) shows two pairs of en-face images (OCT fundus image) of the acquired three-dimensional dataset for the retina of two rats with and without contact lens, respectively. The images cover an area of 1.5 × 1.5 mm2 consisting of 512 (horizontal) × 128 (vertical) pixels and are displayed in grayscale. According to the retinal blood vessel pattern, we can see that the position of the eye is almost the same before and after putting on the contact lens. Compared with the fundus image without contact lens, the one with contact lens obviously provides higher resolution (sharper blood vessel image) and shows more small blood vessels. The contrast and sharpness of blood vessels increase significantly after applying contact lens.
FIGURE 2.
OCT fundus images generated from the acquired 3D OCT datasets for the retina of rat 1 (a and b) and rat 2 (c and d) with (c and d) and without (a and c) contact lens, respectively. (Bar: 150 μm).
Figure 3 shows two pairs of B-scan images for the retina of two rats with and without contact lens, respectively. The images consist of 2048 A-lines and are displayed in grayscale with same dynamic range. From the brightness of these images we can see that the signal intensity of the B-scan images with contact lens is higher than that without contact lens. The retinal layers in the OCT images also become clearer after applying contact lens.
FIGURE 3.
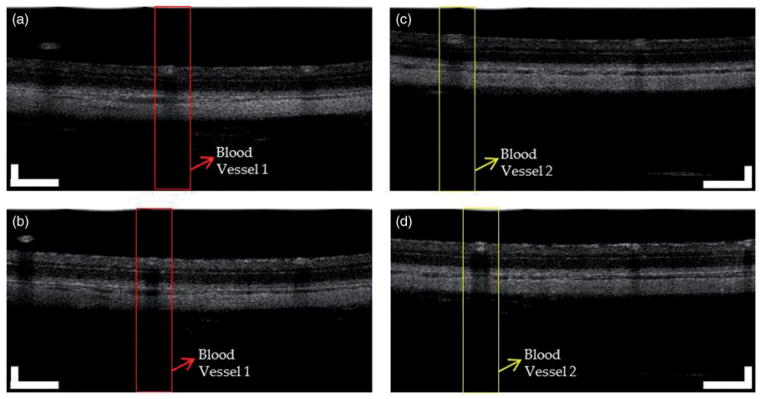
Two pairs of OCT images for the retina of two rats with and without contact lens. (a) and (b): OCT images of rat 1 without and with contact lens. (c) and (d): OCT images of rat 2 without and with contact lens. The images consist of 2048 A-lines. (Bar: 200 μm).
Spatial Resolution
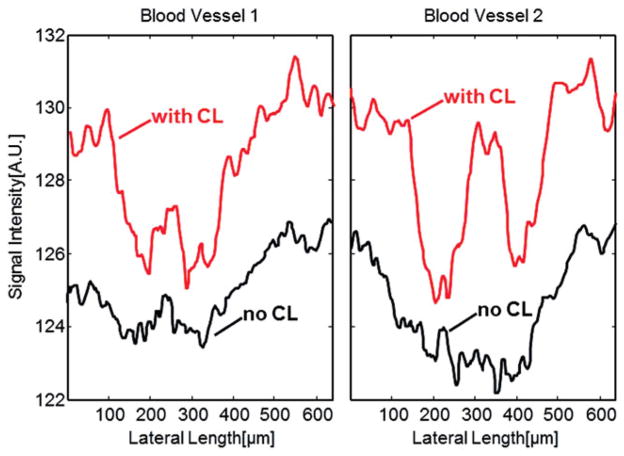
We evaluate the improvement of lateral resolutions of the OCT images by comparing the sharpness of the retinal blood vessels on the corresponding OCT fundus images. To compare the sharpness of retinal blood vessels, we manually identified the OCT cross-sectional images with and without contact lens that contain the same blood vessels at the same location. Figure 3 shows two pairs of the OCT images for two rats (a and b: rat 1 and 2 without contact lens; c and d: rat 1 and 2 with contact lens). We then calculated the vessel profile by summing the pixel intensities in the depth direction, which are shown in Figure 4. As shown in Figure 4, the vessel profiles in the images with contact lens are sharper than that without contact lens for both rats. The central peak (higher reflection) in the vessel profiles is caused by the specular reflection of the vessel wall in the central region of the vessels. The retinal blood vessel profiles are typical when extracted from fundus images acquired by imaging technologies like fundus camera, SLO or OCT.26,27
FIGURE 4.
Blood vessel profiles generated by summation of the OCT signal along the depth direction. (a) The profile of blood vessel 1 in the area marked red in Figure 3(a) and (b); (b) The profile of blood vessel 2 in the area marked yellow in Figure 3(c) and (d).
Signal to Noise Ratio
We compared the signal-to-noise ratio (SNR) between the OCT images with and without contact lens. We manually chose several pairs of B-scan images at the same location of the retina in the corresponding dataset. Figure 5(a) and (b) show one pair of corresponding B-scans chosen from the location marked as a white line in Figure 2(a) and (b), with and without contact lens respectively. A-line signals (or OCT signal) strength at locations marked as white lines on the B-scan images are shown in Figure 5(c) and (d). The A-line signals are displayed in linear scale. We can see that at the same location the OCT signal is much stronger with contact lens than that without contact lens.
FIGURE 5.
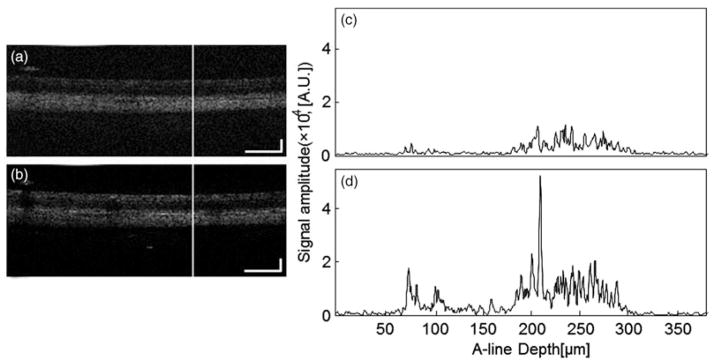
OCT signals at the same location of the retina chosen from a pair of OCT images with and without contact lens, the locations of which are marked as white lines in Figure 2(a) and Figure 2(b). (c) OCT signal without contact lens at the location marked in (a); (d) OCT signal with contact lens at the location marked in (b). (Bar: 200 μm).
We calculated the SNR of nine pairs of A-lines from three pairs of OCT images of three different rat eyes. The results are shown in Table 1. The SNR is calculated by using the formula . In the calculation we determined the noise level by averaging the OCT signals before the top surface of the retina and that below the choroid, while the signal is determined by averaging the OCT signals between the RNFL and the choroid. From the results we can see that the SNR increased 2.9 dB to 10 dB after applying contact lens on the rat eyes.
TABLE 1.
SNR Calculation of OCT A-lines with and without contact lens.
| No lens
|
With lens
|
ΔSNR (dB) | |||||
|---|---|---|---|---|---|---|---|
| Signal strength (counts) | Noise strength (counts) | SNR (dB) | Signal strength (counts) | Noise strength (counts) | SNR (dB) | ||
| Fundus 1 | |||||||
| A-line #1 | 2.11 × 10³ | 531.93 | 11.98 | 4.84 × 10³ | 509.92 | 19.54 | 7.56 |
| A-line #2 | 2.03 × 10³ | 585.14 | 10.79 | 5.96 × 10³ | 597.09 | 19.98 | 9.19 |
| A-line #3 | 2.71 × 10³ | 548.79 | 13.87 | 6.13 × 10³ | 601.64 | 20.16 | 6.29 |
| Fundus 2 | |||||||
| A-line #4 | 3.13 × 10³ | 555.58 | 15.01 | 5.91 × 10³ | 561.86 | 20.44 | 5.43 |
| A-line #5 | 3.12 × 10³ | 531.73 | 15.37 | 4.43 × 10³ | 540.53 | 18.27 | 2.90 |
| A-line #6 | 3.90 × 10³ | 564.10 | 16.80 | 7.08 × 10³ | 611.34 | 21.27 | 4.47 |
| Fundus 3 | |||||||
| A-line #7 | 3.05 × 10³ | 558.51 | 14.74 | 7.85 × 10³ | 600.12 | 22.33 | 7.59 |
| A-line #8 | 2.47 × 10³ | 570.37 | 12.73 | 7.51 × 10³ | 544.96 | 22.78 | 10.06 |
| A-line #9 | 3.26 × 10³ | 609.55 | 14.57 | 6.54 × 10³ | 612.62 | 20.57 | 5.99 |
DISCUSSION
From the experimental results we can see that both the spatial resolution and SNR of the OCT images were improved significantly after applying contact lens on the rat eyes. The results suggest that after applying contact lens the probing beam was focused better on the retina (smaller focal spot). Since the contact lens used in our experiments is powerless and each OCT image was acquired by adjusting the ocular lens to achieve the best image quality, we believe that the improvement of image quality is not caused by focus change.
We hypothesize that the image quality was improved as a result of smaller wave-front error of the anterior segment of the eye with contact lens. We all know that the corneal surface of rodent eyes frequently has various defects. These defects induce wave front errors which will add to the aberrations of the rodent eye. Since we added artificial tears in the contact lens before put it on the eye, the defects of the corneal surface may be smoothed out by the post-lens tear film. As a result, the aberrations of the eye may be partially compensated by the contact lens and lead to better OCT image quality. Since we do not have a wave-front sensor to measure the aberrations of the rodent eyes the hypothesis was not verified in our lab. Further experiments using a wave-front sensor may help verify the hypothesis.
In conclusion, we have for the first time investigated the effect of powerless contact lens on OCT imaging of rodent retina. By comparing the OCT images of rat retina with and without contact lens, we have demonstrated that using contact lens on rat eyes can significantly improve the lateral resolution and SNR of OCT images. This work demonstrated that contact lens can not only help prevent cataract formation in rodent eyes during imaging but also significantly improve the image quality of rodent retina.
Footnotes
DECLARATION OF INTEREST
This work is supported in part by the following grants: National Institutes of Health grant 5R01EY019951-03 and Coulter Translational Award. There are no conflicts of interest in this paper. The authors alone are responsible for the content and writing of the paper.
References
- 1.Huang D, Swanson EA, Lin CP, Schuman JS, Stinson WG, Chang W, et al. Optical coherence tomography. Science. 1991;254:1178–1181. doi: 10.1126/science.1957169. [DOI] [PMC free article] [PubMed] [Google Scholar]
- 2.Swanson EA, Izatt JA, Hee MR, Huang D, Lin CP, Schuman JS, et al. In vivo retinal imaging by optical coherence tomography. Opt Lett. 1993;18:1864–1866. doi: 10.1364/ol.18.001864. [DOI] [PubMed] [Google Scholar]
- 3.Hee MR, Izatt JA, Swanson EA, Huang D, Schuman JS, Lin CP, et al. Optical coherence tomography of the human retina. Arch Ophthalmol. 1995;113:325–332. doi: 10.1001/archopht.1995.01100030081025. [DOI] [PubMed] [Google Scholar]
- 4.Nassif N, Cense B, Park B, Pierce M, Yun S, Bouma B, et al. In vivo high-resolution video-rate spectral-domain optical coherence tomography of the human retina and optic nerve. Opt Express. 2004;12:367–376. doi: 10.1364/opex.12.000367. [DOI] [PubMed] [Google Scholar]
- 5.Chen TC, Cense B, Pierce MC, Nassif N, Park BH, Yun SH, et al. Spectral domain optical coherence tomography: ultra-high speed, ultra-high resolution ophthalmic imaging. Arch Ophthalmol. 2005;123:1715–1720. doi: 10.1001/archopht.123.12.1715. [DOI] [PubMed] [Google Scholar]
- 6.Ruggeri M, Wehbe H, Jiao S, Gregori G, Jockovich ME, Hackam A, et al. In Vivo Three-Dimensional High-Resolution Imaging of Rodent Retina with Spectral-Domain Optical Coherence Tomography. Invest Ophthalmol Vis Sci. 2007;48:1808–1814. doi: 10.1167/iovs.06-0815. [DOI] [PubMed] [Google Scholar]
- 7.Kim KH, Puoris’ haag M, Maguluri GN, Umino Y, Cusato K, Barlow RB, et al. Monitoring mouse retinal degeneration with high-resolution spectral-domain optical coherence tomography. J Vis. 2008;8:17.1–17.11. doi: 10.1167/8.1.17. [DOI] [PubMed] [Google Scholar]
- 8.Fischer MD, Huber G, Beck SC, Tanimoto N, Muehlfriedel R, Fahl E, et al. Noninvasive, in vivo assessment of mouse retinal structure using optical coherence tomography. PLoS One. 2009;4:e7507. doi: 10.1371/journal.pone.0007507. [DOI] [PMC free article] [PubMed] [Google Scholar]
- 9.Xu J, Molday LL, Molday RS, Sarunic MV. In vivo imaging of the mouse model of X-linked juvenile retinoschisis with fourier domain optical coherence tomography. Invest Ophthalmol Vis Sci. 2009;50:2989–2993. doi: 10.1167/iovs.08-2542. [DOI] [PMC free article] [PubMed] [Google Scholar]
- 10.Ruggeri M, Tsechpenakis G, Jiao S, Jockovich ME, Cebulla C, Hernandez E, et al. Retinal tumor imaging and volume quantification in mouse model using spectral-domain optical coherence tomography. Opt Express. 2009;17:4074–4083. doi: 10.1364/oe.17.004074. [DOI] [PMC free article] [PubMed] [Google Scholar]
- 11.Shousha MA, Perez VL, Wang J, Ide T, Jiao S, Chen Q, et al. Use of ultra-high-resolution optical coherence tomography to detect in vivo characteristics of Descemet’s membrane in Fuchs’ dystrophy. Ophthalmology. 2010;117:1220–1227. doi: 10.1016/j.ophtha.2009.10.027. [DOI] [PMC free article] [PubMed] [Google Scholar]
- 12.Pennesi ME, Michaels KV, Magee SS, Maricle A, Davin SP, Garg AK, et al. Long-term characterization of retinal degeneration in rd1 and rd10 mice using spectral domain optical coherence tomography. Invest Ophthalmol Vis Sci. 2012;53:4644–4656. doi: 10.1167/iovs.12-9611. [DOI] [PMC free article] [PubMed] [Google Scholar]
- 13.Liang J, Williams DR, Miller DT. Supernormal vision and high-resolution retinal imaging through adaptive optics. Josa A. 1997;14:2884–2892. doi: 10.1364/josaa.14.002884. [DOI] [PubMed] [Google Scholar]
- 14.Roorda A, Romero-Borja F, Donnelly WJ, Queener H, Hebert TJ, Campbell MCW. Adaptive optics scanning laser ophthalmoscopy. Opt Express. 2002;10:405–412. doi: 10.1364/oe.10.000405. [DOI] [PubMed] [Google Scholar]
- 15.Porter J, Queener H, Lin J, Thorn K, Awwal A. Adaptive optics for vision science. Wiley Online Library; 2006. [Google Scholar]
- 16.Geng Y, Greenberg KP, Wolfe R, Gray DC, Hunter JJ, Dubra A, et al. In Vivo Imaging of Microscopic Structures in the Rat Retina. Invest Ophthalmol Vis Sci. 2009;50:5872–5879. doi: 10.1167/iovs.09-3675. [DOI] [PMC free article] [PubMed] [Google Scholar]
- 17.Barbero S, Marcos S, Jimenez-Alfaro I. Optical aberrations of intraocular lenses measured in vivo and in vitro. Josa A. 2003;20:1841–1851. doi: 10.1364/josaa.20.001841. [DOI] [PubMed] [Google Scholar]
- 18.Burns SA, Zhou Y, Lin CP, Bifano TG, Veilleux I, Webb RH. Retinal imaging and wavefront sensing in mice. Invest Ophthalmol Vis Sci. 2004;45:2787. [Google Scholar]
- 19.de la Cera EG, Rodriguez G, Llorente L, Schaeffel F, Marcos S. Optical aberrations in the mouse eye. Vis Res. 2006;46:2546–2553. doi: 10.1016/j.visres.2006.01.011. [DOI] [PubMed] [Google Scholar]
- 20.Srinivasan VJ, Ko TH, Wojtkowski M, Carvalho M, Clermont A, Bursell S-E, et al. Noninvasive volumetric Imaging and morphometry of the rodent retina with high-speed, ultrahigh-resolution optical coherence tomography. Invest Ophthalmol Vis Sci. 2006;47:5522–5528. doi: 10.1167/iovs.06-0195. [DOI] [PMC free article] [PubMed] [Google Scholar]
- 21.Ridder WH, Nusinowitz S, Heckenlively JR. Causes of cataract development in anesthetized mice. Exp Eye Res. 2002;75:365–370. doi: 10.1006/exer.2002.2007. [DOI] [PubMed] [Google Scholar]
- 22.Kawaguchi I, Higashide T, Ohkubo S, Takeda H, Sugiyama K. In vivo imaging and quantitative evaluation of the rat retinal nerve fiber layer using scanning laser ophthalmoscopy. Invest Ophthalmol Vis Sci. 2006;47:2911–2916. doi: 10.1167/iovs.05-1169. [DOI] [PubMed] [Google Scholar]
- 23.Huber G, Beck SC, Grimm C, Sahaboglu-Tekgoz A, Paquet-Durand F, Wenzel A, et al. Spectral domain optical coherence tomography in mouse models of retinal degeneration. Invest Ophthalmol Vis Sci. 2009;50:5888–5895. doi: 10.1167/iovs.09-3724. [DOI] [PMC free article] [PubMed] [Google Scholar]
- 24.Bartsch D, Zinser G, Freeman WR. Technical digest. Washington, DC: OSA; 1994. Resolution improvement in confocal scanning laser tomography of the human fundus. Vision Science and its applications; pp. 134–137. [Google Scholar]
- 25.American National Standard for Safe Use of Lasers, ANSI Z136.1. 2007. [Google Scholar]
- 26.Wehbe H, Ruggeri M, Jiao S, Gregori G, Puliafito CA, Zhao W. Automatic retinal blood flow calculation using spectral domain optical coherence tomography. Opt Express. 2007;15:15193–15206. doi: 10.1364/oe.15.015193. [DOI] [PubMed] [Google Scholar]
- 27.Weber A, Cheney M, Smithwick Q, Elsner A. Polarimetric imaging and blood vessel quantification. Opt Express. 2004;12:5178–5190. doi: 10.1364/opex.12.005178. [DOI] [PubMed] [Google Scholar]


