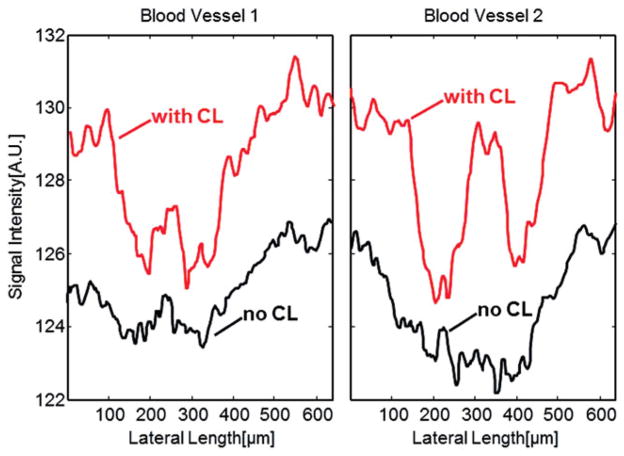
FIGURE 4.
Blood vessel profiles generated by summation of the OCT signal along the depth direction. (a) The profile of blood vessel 1 in the area marked red in Figure 3(a) and (b); (b) The profile of blood vessel 2 in the area marked yellow in Figure 3(c) and (d).

