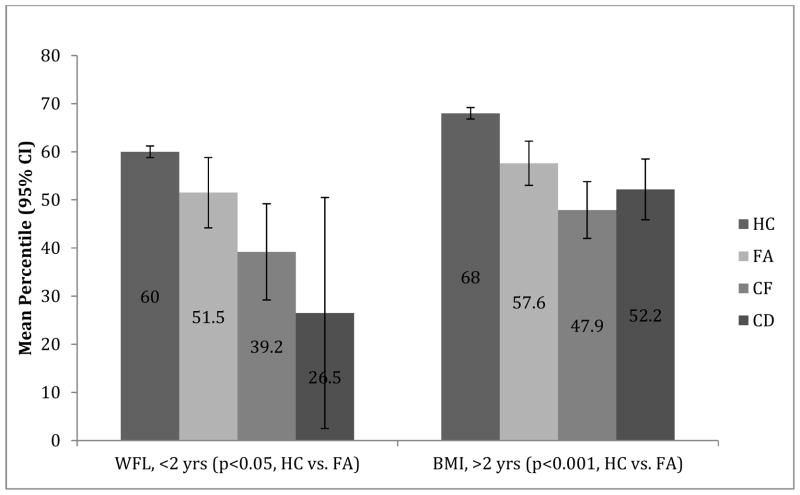
Figure 1.
WFL/BMI Percentiles by Age Group. This figure compares mean WFL/BMI percentiles of 4 groups of children: healthy controls (HC), food allergic (FA), cystic fibrosis (CF), and celiac disease (CD). ). P-values represent Wald statistics of difference between the healthy and food allergy groups; error bars represent 95% confidence intervals.

