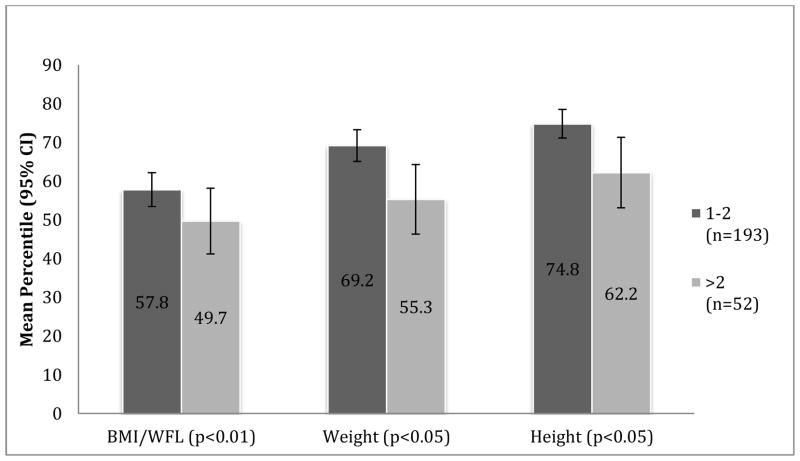
Figure 2.
Growth Percentiles per Number of Food Allergies. Within the food-allergic cohort, 192 subjects were found to have 1–2 food allergies and 52 were found to have >2 food allergies. Those with >2 allergies had significantly lower mean weight percentile (55.3 [95% CI: 46.3–64.4] vs. 69.2 [95% CI: 65.1–73.3], p<0.01) and height percentile (62.2 [95% CI:53.1–71.2] vs. 74.8 [71.1–78.5], p<0.05) percentiles, respectively.

