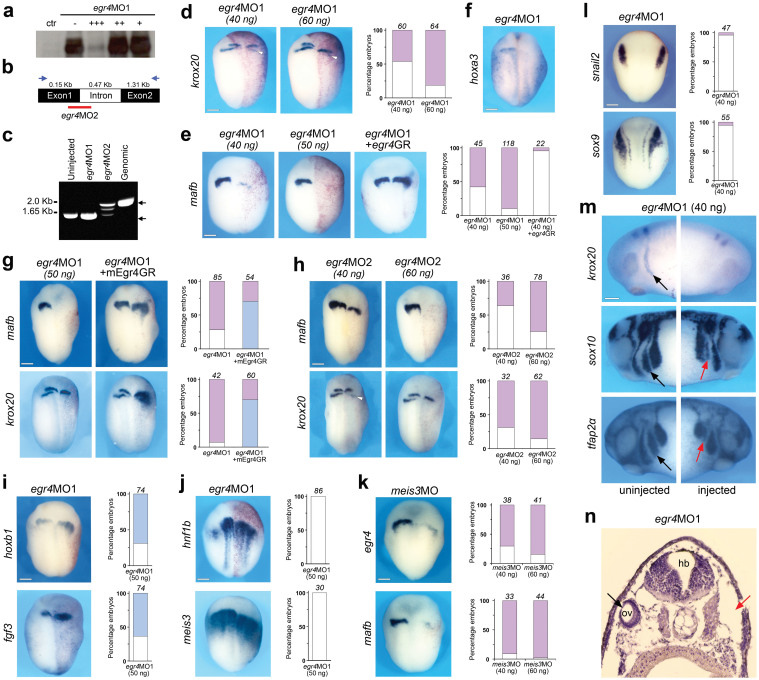
Figure 3. Egr4 is required for caudal hindbrain development.
(a) Increasing amounts of egr4MO1 10 ng (+), 100 ng (++), and 1000 ng (+++) blocks translation directed by egr4 mRNA in an in vitro coupled transcription/translation reaction. Full-length blot is presented in Supplementary Figure 1. (b) Schematic representation of the egr4 locus. The PCR primers used for the analysis of spliced transcripts are indicated (blue arrows). The position of the splice (egr4MO2) blocking MO is indicated. (c) In egr4MO2-injected embryos a larger egr4 transcript is detected (~2.0 kb) due to intron retention. For all samples, the RT-PCR was performed under the same experimental conditions. (d–f) Unilateral injection of egr4MO1 at the 2-cell stage caused a reduction of expression of krox20 in r5 (d), mafb in r5/r6 (e) and hoxa3 (f). Note the residual krox20 in r5 (arrowheads). Injection of Xenopus egr4GR (e) or mouse Egr4GR (g) mRNAs (100 pg) can efficiently rescue mafb or krox20 expression in egr4-depleted embryos. (h) Unilateral injection of egr4MO2 results in a specific reduction/loss of expression of krox20 in r5 and mafb in r5/r6. Note the residual krox20 in r5 (arrowhead; left panel). (i–j) Unilateral injection of egr4MO1 (50 ng) at the 2-cell stage caused a posterior expansion of hoxb1 and fgf3 (i), while hnf1b and meis3 were largely unaffected (j). (k) Unilateral injection of meis3MO (40 ng) at the 2-cell stage caused a reduction of egr4 and mafb expression. (l) Egr4 knockdown (egr4MO1; 40 ng) has no effect on snail2 and sox9 expression at the neural plate border. In all panels (d–l), the graphs indicate the percentage of embryos with normal (white), reduced/lost (red) or expanded/ectopic (blue) gene expression. The number of embryos analyzed is indicated on top of each bar. Dorsal views, anterior to top. (m) At stage 25 egr4MO1-injected embryos (40 ng) show a specific loss of anterior branchial neural crest stream that normally travels to the third branchial arch (red arrows). Lateral views, anterior to left (uninjected side; black arrows) or to right (injected side; red arrows), dorsal to top. Panels (d–m) scale bars, 300 μm. (n) Transverse section through an embryo injected with 40ng of egr4MO1. On the injected side (red arrow) the otic vesicle failed to form. The otic vesicle on the control side is indicated (black arrow). hb: hindbrain; ov: otic vesicle.

