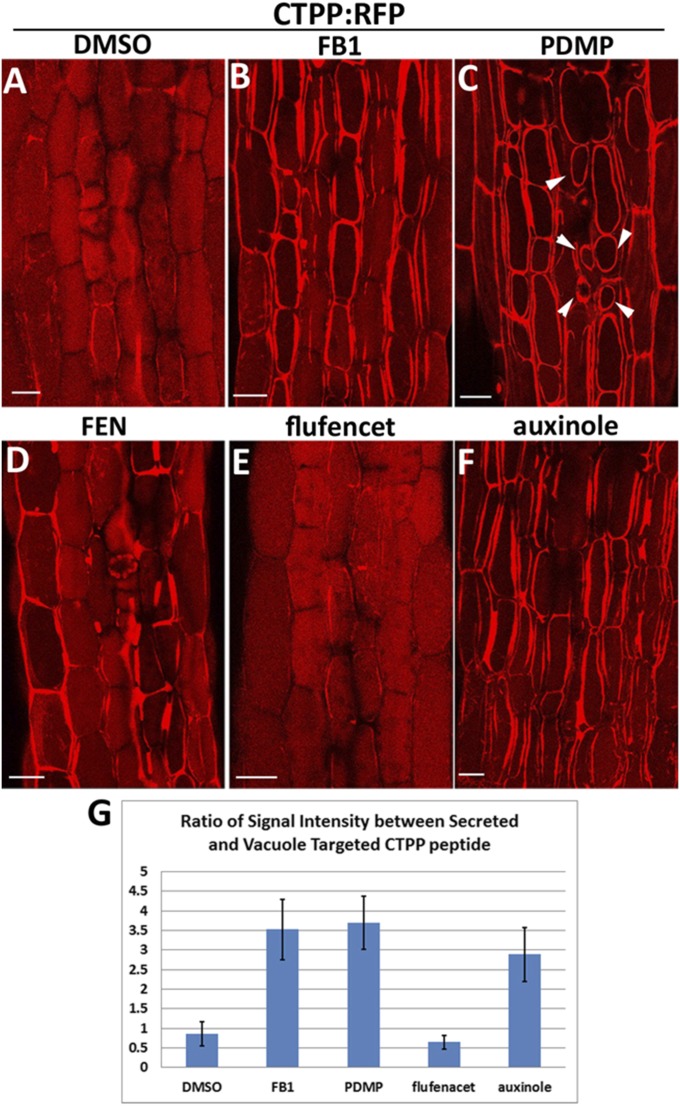
Fig. 3.
Lipid biosynthesis inhibitor induced secretion of CTPP signal peptide and altered auxin response. (A–F) Images of hypocotyl cells from RFP:CTPP lines after 24-h treatment of DMSO (0.1%), FB1 (5 μM), PDMP (1 μM), FEN (100 μM), flufenacet (1 μM), or auxinole (5 μM). (Scale bars, 10 μm.) (G) Quantification of the ratio between secreted RFP:CTPP signal and vacuole targeting signal; 300 cells from 10 seedlings for each treatment were analyzed. Error bars represent SD.

