Fig. 2.
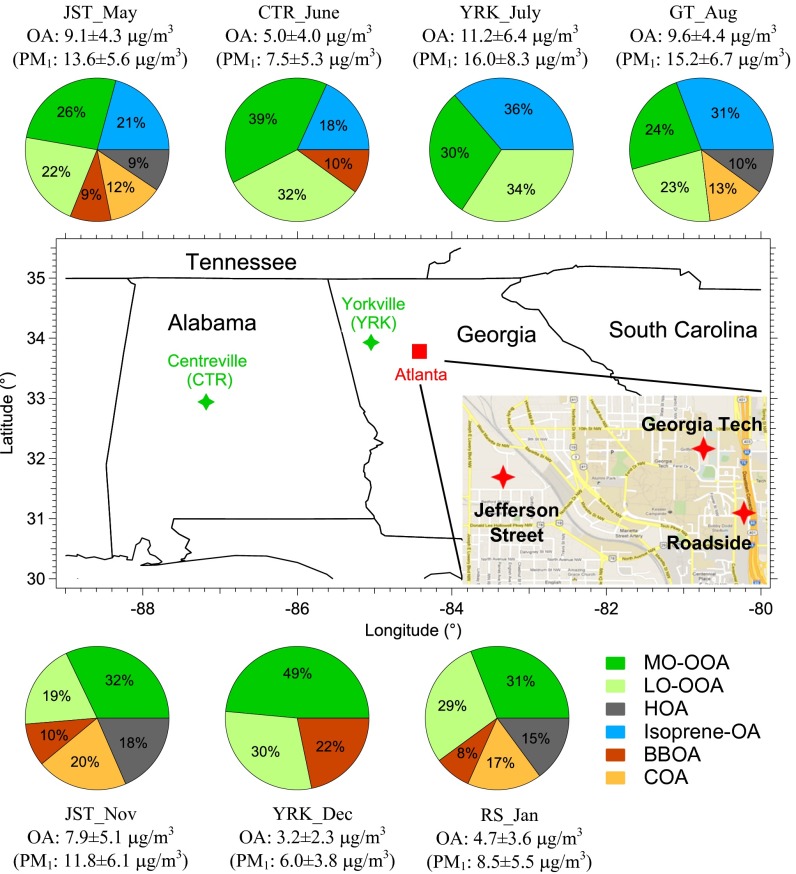
Geographical locations and organic aerosol characterization of SOAS and SCAPE field campaigns in the southeastern US. Inset shows a detailed map of Atlanta (adapted from Google Maps). Abbreviations correspond to Centerville (CTR), Yorkville (YRK), Jefferson Street (JST), Georgia Institute of Technology (GT), and Roadside (RS). Details about sampling period at each site are listed in SI Appendix, Table S1. Measurement sites are classified based on their locations as urban (red star) and rural (green star). The pie charts report the source apportionment of organic aerosol. The mass concentrations ± 1 SD of organics and PM1 as measured by HR-ToF-AMS are also reported. The identified OA subtypes are MO-OOA (more-oxidized oxygenated OA), LO-OOA (less-oxidized oxygenated OA), Isoprene-OA (isoprene-derived OA), BBOA (biomass burning OA), HOA (hydrocarbon-like OA), and COA (cooking OA). Isoprene-OA is only identified in the warmer months (from May to September), and LO-OOA is identified at various rural and urban sites throughout the year. While the first four factors are discussed in OA Source Apportionment, the identification of HOA and COA is discussed in SI Appendix, Positive Matrix Factorization. Isoprene-OA and LO-OOA account for 43–70% of total measured OA in summer time.

