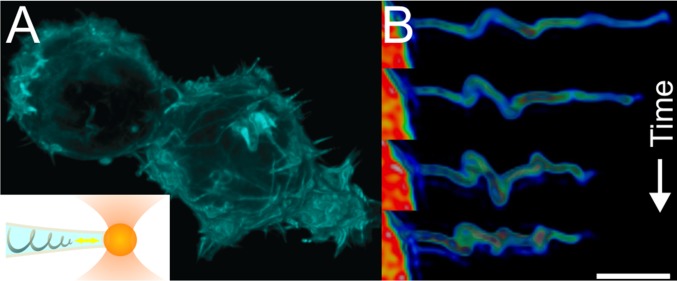
Fig. 1.
Actin dynamics inside filopodia studied by simultaneous force spectroscopy and confocal microscopy. (A) HEK293 cells display a high density of short filopodia on their surface as visualized by fluorescently labeled F-actin (GFP-Utrophin). Inset shows schematics of the F-actin inside a filopodium held in place by an optically trapped bead (diameter = 4.95 μm) showing helical bending of the actin shaft. The yellow double arrow indicates the observed dynamic movement of the actin near the tip of the filopodium. (B) Deconvoluted 3D reconstruction of the fluorescently labeled F-actin (GFP-Utrophin) inside an extended filopodium. The images are taken at times t = 50.4, 84.0, 100.8, and 151.2 s after extension with an optically trapped bead. (Scale bar: 3 μm.)

