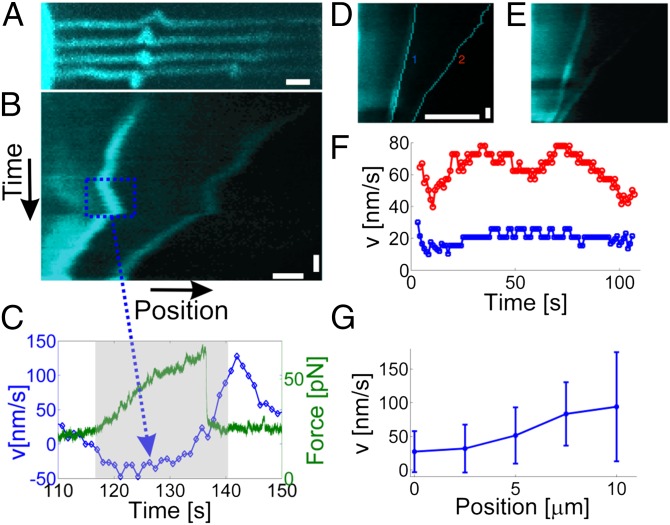
Fig. 2.
Quantification of the velocity of actin coils traveling toward the cell body. (A) Progressive bending and traveling of two coils. The four images show the same actin filament at four consecutive time points (t1 = 75.9 s, t2 = 91.5 s, t3 = 93.6 s, and t4 = 116.5 s). Notably, the leftmost coil initially points upward and gradually rotates ∼180°. (Scale bar: 1 μm.) See also Movie S2. (B) Kymograph of the coils in A showing the positions of the coils versus time. Importantly, the position of the coil is consistently quantified in the reference frame of the trapped bead. The blue dashed rectangle shows the occurrence of a reversal in the velocity of the coil relative to the trapped bead. (Scale bars: 1 μm and 10 s.) (C) Quantification of the coil velocity (blue) and the corresponding pulling force on the trapped bead (green). The gray shaded area denotes the approximate time interval during which the velocity becomes negative in B. (D and E) Examples of two coils located at different distances relative to the cell body and traveling at different velocities. The positions of the coils are shown in D; these were found as the maximum of the intensity gradient of the raw data shown in E. (Scale bars: 5 μm and 10 s.) (F) The velocities of the two coils in D; the blue curve is from the left coil, and the red is from the right coil. (G) Distribution of velocities from n = 40 coils as a function of distance from the cell body. Error bars denote ±1SD.

