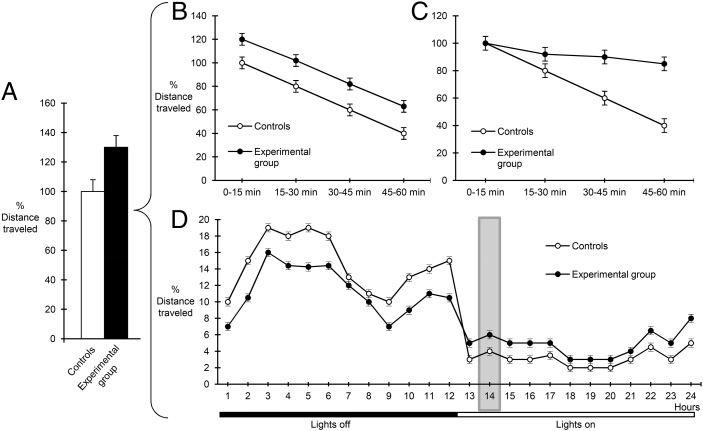
Fig. 1.
Graphic illustration of different movement patterns that can lead to increases in apparent animal locomotion. (A) Measurement of the total distance covered in a 60-min period in a locomotor activity task shows a 30% increase in apparent locomotion in experimental (black bar) vs. control animals (white bar). Such an increase in total movement in a novel environment can reflect either genuine hyperactivity (B), with greater distances equally spread over the entire 1-h observation period, or a deficit in habituation (C), where the two groups of animals show similar initial mobility (first 15-min period) but fail to adapt to the novel environment with time (subsequent three 15-min periods). (D) In a familiar home-cage environment, a 30% increase in locomotion observed in the experimental animals during a 1-h period in the active phase (time point 14, shaded area), as reported in Schweizer et al. (2), could reflect alterations in locomotor circadian rhythm and not the animals’ overall activity levels (identical total values in the two groups over the 24 h).

