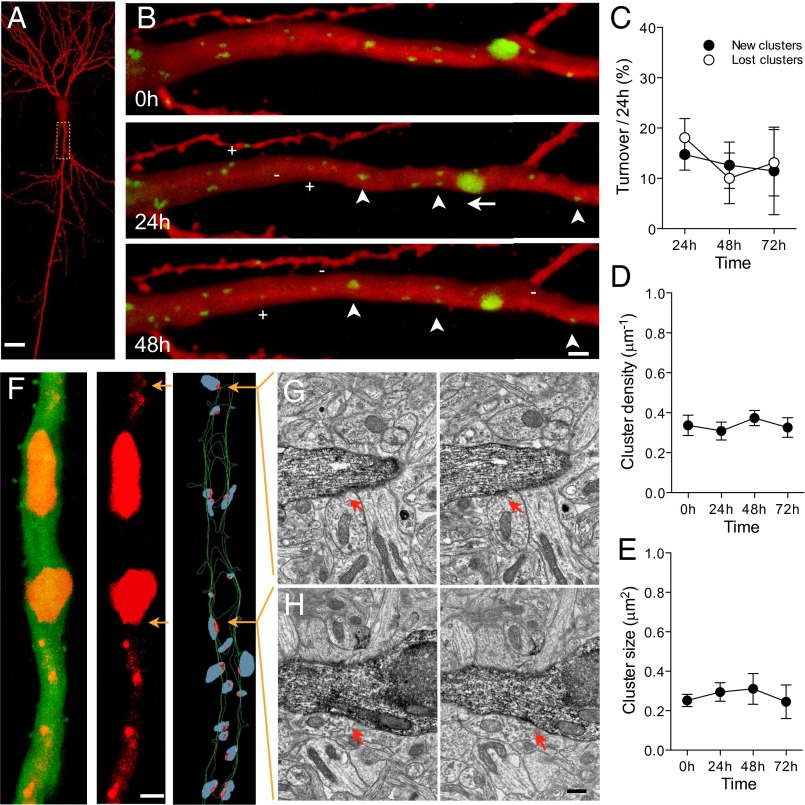
Fig. 1.
Basal turnover of gephyrin-containing inhibitory synapses in rat organotypic hippocampal cultures. (A) Low maginification view of a mRFP-transfected CA1 pyramidal neuron imaged 8 d after transfection at 19 DIV. (B) Repetitive imaging at 24 h interval of the proximal dendrite of a eGFP-gephyrin transfected neuron. Note the variations in size of gephyrin clusters (green) and the existence of movements (arrow), stable (arrowheads), new (+), and lost (-) clusters. (C) Quantitative analysis of gephyrin turnover expressed as the fraction of new (filled circles) and lost (open circles) clusters observed over 24 h per proximal dendrite (n = 11 cells/134 clusters). (D) Absence of changes in cluster density under basal conditions. (E) Absence of changes in the mean size of gephyrin clusters. (F Left) Confocal projection of an apical proximal dendrite of a pyramidal neuron transfected with eGFP and mCherry-gephyrin. Middle shows only the mCherry-gephyrin signal, and Right illustrates the 3D EM reconstruction of the same dendrite. Red dots represent inhibitory symmetrical synapses and blue dots are the superimposed presynaptic boutons. Note that all small gephyrin clusters correlate with inhibitory synapses, whereas the large gephyrin clusters correspond to gephyrin accumulations in areas where multiple inhibitory synapses are present. (G) Electron microscopic image of the small confocal gephyrin cluster illustrated by the top arrow on F Right. The reconstructed dendrite was identified through eGFP immunolabeling. (H) Same but for the large inhibitory synapse corresponding to the large gephyrin cluster illustrated in F (lower arrow). (Scale bars: A, 10 μm; B and F Left, 2 μm; H, 0.2 μm.)

