Fig. 3.
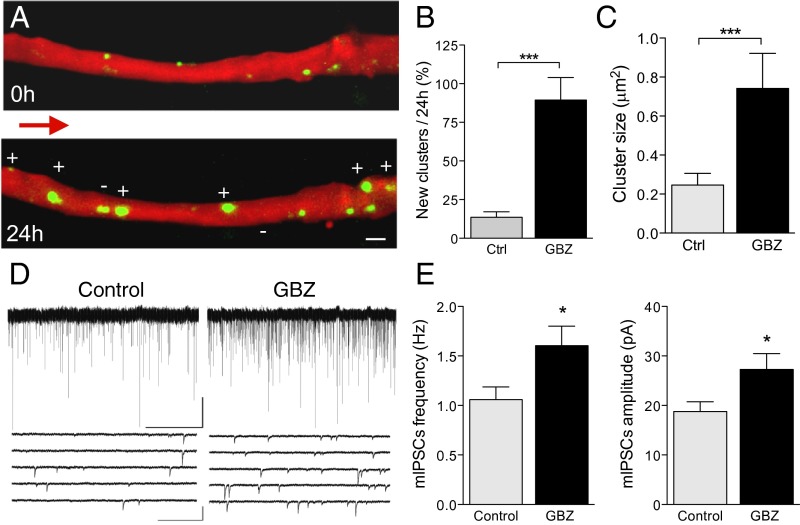
Increase in gephyrin cluster dynamics by the GABAAR antagonist gabazine (GBZ). (A) Proximal apical dendrite before and 24 h after a short GBZ treatment (45 min). Note the marked increase in number (+) and size of gephyrin clusters. (B) Proportion of new gephyrin clusters observed 24 h after a short GBZ treatment (Ctrl, open columns, n = 7 cells/57 clusters; GBZ, filled columns, n = 7 cells/36 clusters). (C) Changes in mean size of gephyrin clusters. (D) Illustration of mIPSCs recorded in nontransfected CA1 pyramidal neurons under control conditions (Left) and 24 h after a short GBZ treatment. (E) Increase in mIPSC frequency (Left) and amplitude (Right) induced by GBZ (Ctrl, open columns, n = 11 cells; GBZ, filled columns, n = 11 cells). (Scale bars: A, 2 μm; D, Top Right, 50 pA/50 s; D, Bottom Right, 100 pA/0.5 s.)

