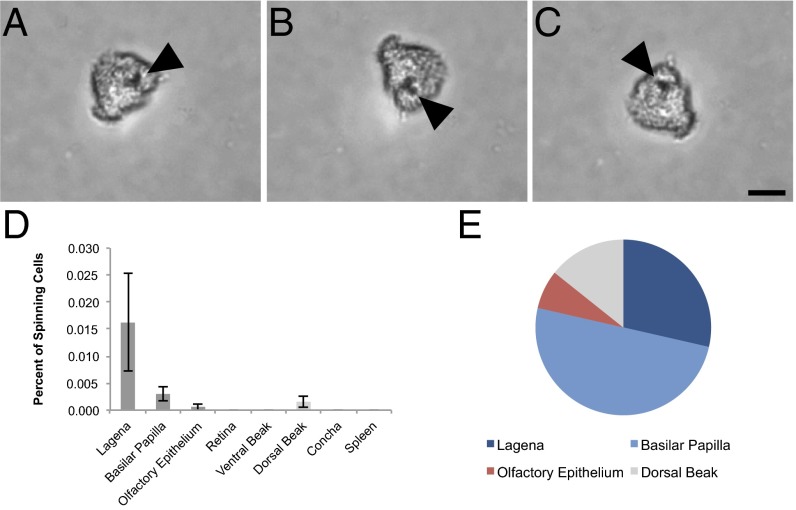
Fig. 1.
Results of magnetic cell screening. Tissue dissociates were exposed to a rotating magnetic field, and magnetic cells were identified by their spinning behavior. (A–C) Sequential images of a rotating cell from the inner ear lagena. An opaque inclusion is indicated with the arrow. (Scale bar: 10 μm.) (D) Percentage of cells with magnetic properties by tissue (mean ± SEM). We observed the highest percentage of spinning cells in the lagena and basilar papilla. (E) Proportion of total magnetic cells in each tissue (n = 10 birds, n = 14 spinning cells, n ≥ 6.6 million cells screened).

