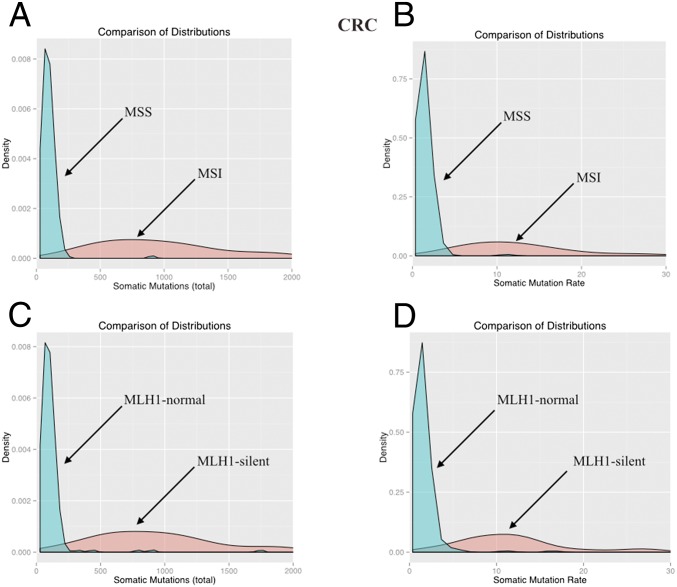
Fig. 2.
Distributions of the total number of somatic mutations (A and C) and of the somatic mutation rates (somatic mutations per year) (B and D) in MMR-proficient (MSS or MLH1-normal) and MMR-deficient (MSI or MLH1-silent) CRCs. The rightmost parts of each red distribution have been excluded to facilitate comparison.

