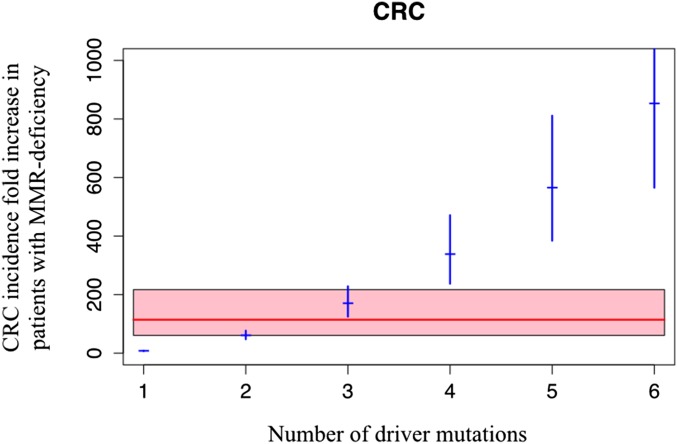
Fig. 4.
Relation between the number of rate-limiting driver mutations and the increase in CRC incidence observed in patients with MMR deficiency. The observed average increase in incidence associated with MMR deficiency is 114.2-fold (red line); the pink area is its 95% CI (60.7–217) (14). The expected increase in CRC incidence associated with the indicated number of rate-limiting mutations is represented by the blue marks, with the corresponding 95% CI indicated by blue vertical segments.

