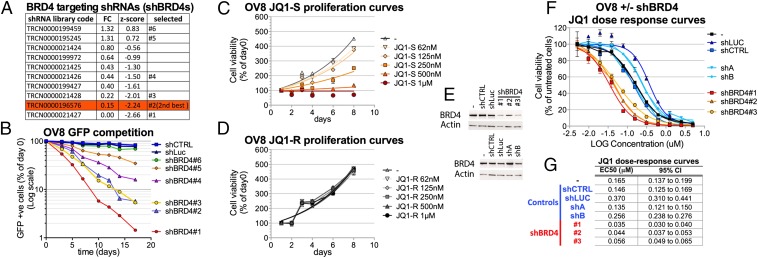
Fig. 3.
BRD4 depletion or inhibition impairs OV8 proliferation. (A) List of BRD4 targeting shRNAs analyzed in the screen and selected for further testing. For each shRNA is reported the fold change value (FC) and the z-score obtained in the screen. (B) GFP competition assays with multiple shRNAs directed against BRD4 (shBRD4). (C and D) OV8 proliferation curves in the presence of increasing concentrations of the active BRD4 inhibitor JQ1-S (C) or the inactive enantiomer JQ1-R (D). Cell viability was measured by Cell Titer Glow assay (i.e., for ATP concentration) and for each time point is reported as the percent of the value obtained on day 0. (E–G) OV8 cells were infected with each of the indicated shRNAs at MOI > 1, selected for 48 h with Puromycin and plated for further experiments. shCTRL and shLuc are control lentiviruses. shA and shB are two additional control shRNAs that affect proliferation but not BRD4 levels. (E) Western blot analysis of BRD4 expression in OV8 (−) and OV8 infected with each of the indicated shRNAs. (F) JQ1 dose–response curves in OV8 (−) and OV8 infected with each of the indicated shRNAs. Cell viability was measured by the Cell Titer Glow assay, and each value was reported as a percentage of the effect obtained by using the vehicle alone. (G) Comparison of the EC50 values (micromolar) obtained from the JQ1 dose–response curves performed in the various conditions. 95% confidence intervals (95% CI) are also shown. Where reported, error bars represent standard deviations of triplicate measurements.

